Observability ?
Observability 정의는 시스템에서 외부로 출력되는 값알을 사용해서, 시스템의 내부 상태를 이해하고 예측하는 것 입니다.
구체적으로 장애가 발생할 위험이 있으면 미리 예측하고 운영자에게 통지하거나, 리소스의 증감을 미리 예측하는 것이라고 합니다.
예측이 반복되는 것처럼 미래에 발생할 이벤트를 예측하고 IT운영을 자동화하는 것에 목적을 둡니다.
Observability 는 메트릭, 로깅, 트레이싱 3가지로 구성됩니다.
- 메트릭(Metrics): 시스템의 성능 및 상태를 수치화하여 수집하는 데이터 (예: CPU 사용률, 요청 응답 시간).
- 로깅(Logging): 시스템에서 발생하는 이벤트나 오류를 시점별로 기록하는 데이터 (예: 에러 로그, 디버그 메시지).
- 트레이싱(Tracing): 분산 시스템에서 하나의 요청이 여러 서비스 간을 이동하는 경로를 추적하는 데이터 (예: 마이크로서비스 간 API 호출 추적).
위 구성요소를 통해 과거 및 현재 상태를 분석하면 장애 발생 패턴을 파악하고, 시스템 성능 저하나 장애를 사전에 감지할 수 있습니다.
예를 들어, 메트릭을 활용해 CPU 사용량이 급증하는 패턴을 분석하고, 로그를 통해 특정 오류가 반복되는 원인을 파악하며, 트레이싱을 통해 성능 저하가 특정 서비스에서 발생하는지를 추적할 수 있습니다.
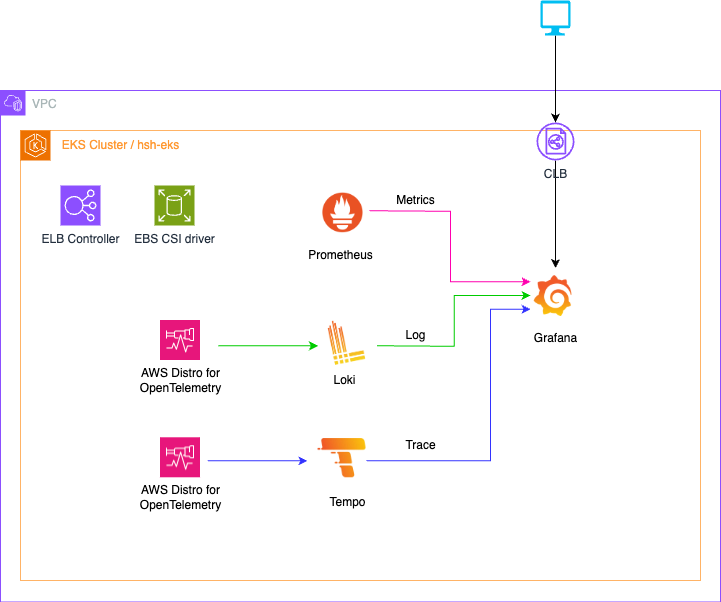
이번 글에서는 Grafana Stack을 통해 Observability 구성하겠습니다.
Prometheus, Grafana, Loki, ADOT, Tempo를 활용하였고, 단일 EKS 내에서 모두 구성하였습니다.
환경 구성
테라폼을 통해 AWS EKS 기본 환경을 구성하였습니다.
필자의 깃 레파지토리를 참고해주세요.
EKS Version 1.31 Node t3.medium 2대 ALB Controller, EBS CSI Drvier, kube-prometheues-stack
⌨️ git clone https://github.com/HanHoRang31/blog-share.git

⌨️ cd blog-share/aews3-observability/grafana-eks-simple

⌨️ ./isntall.sh - 약 15분정도 소요됩니다.
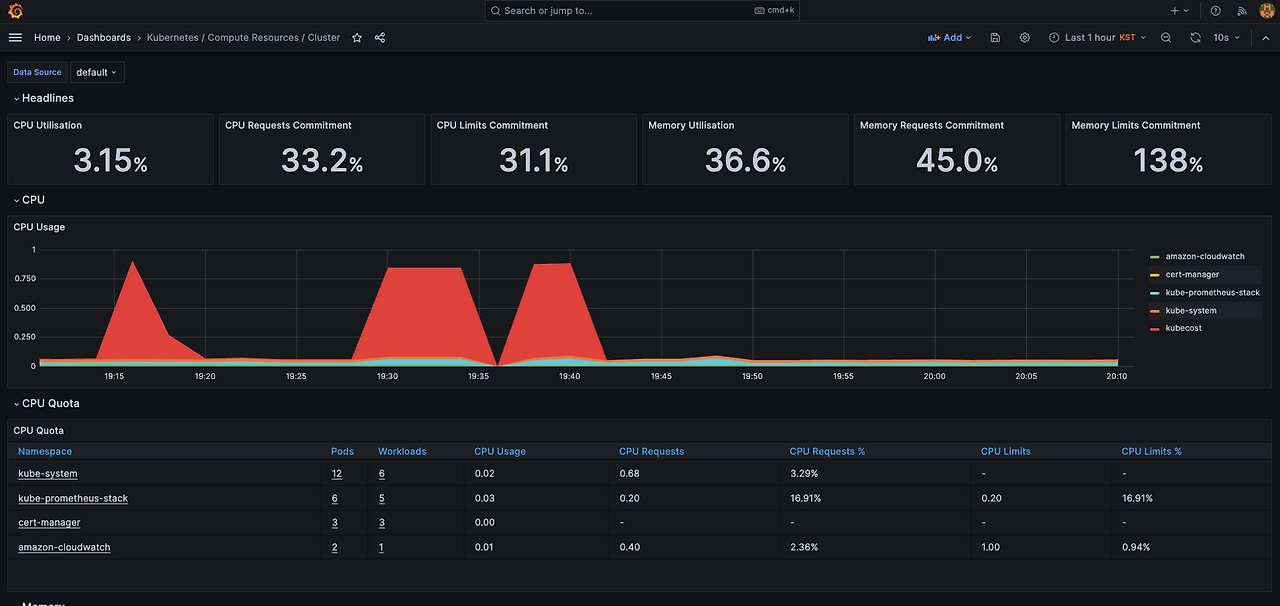
메트릭 확인
메트릭은 테라폼을 통해 Prometheus로 배포하였습니다.
필자 기준 opentelemetry 로도 메트릭 수집이 가능하지만, 기타 활용되는 addon 들이 많고 kube-monitor 라는 자동화라는 특징으로 프로메테우스를 선호하여 구성하였습니다.
메트릭 & 대시보드 구성 확인
⌨️ kubectl get pods -A
NAMESPACE               NAME                                                        READY   STATUS    RESTARTS   AGE
amazon-cloudwatch       aws-cloudwatch-metrics-5bvv5                                1/1     Running   0          35m
amazon-cloudwatch       aws-cloudwatch-metrics-7p5dl                                1/1     Running   0          35m
kube-prometheus-stack   kube-prometheus-stack-grafana-b85b77cf4-7q2sv               3/3     Running   0          22m
kube-prometheus-stack   kube-prometheus-stack-kube-state-metrics-7857ff9764-67rjq   1/1     Running   0          22m
kube-prometheus-stack   kube-prometheus-stack-operator-857c7b8dd9-wh95p             1/1     Running   0          22m
kube-prometheus-stack   kube-prometheus-stack-prometheus-node-exporter-pkthc        1/1     Running   0          22m
kube-prometheus-stack   kube-prometheus-stack-prometheus-node-exporter-rhqws        1/1     Running   0          22m
kube-prometheus-stack   prometheus-kube-prometheus-stack-prometheus-0               2/2     Running   0          22m
kube-system             aws-load-balancer-controller-8bffc8f4-sdmnz                 1/1     Running   0          35m
kube-system             aws-load-balancer-controller-8bffc8f4-snsm7                 1/1     Running   0          35m
kube-system             aws-node-8x8ph                                              2/2     Running   0          35m
kube-system             aws-node-btnxs                                              2/2     Running   0          35m
kube-system             coredns-86f5954566-6x46d                                    1/1     Running   0          35m
kube-system             coredns-86f5954566-tp2pw                                    1/1     Running   0          35m
kube-system             ebs-csi-controller-6cf86f5ff5-4cw42                         6/6     Running   0          35m
kube-system             ebs-csi-controller-6cf86f5ff5-djt2t                         6/6     Running   0          35m
kube-system             ebs-csi-node-7hkkw                                          3/3     Running   0          35m
kube-system             ebs-csi-node-wxl99                                          3/3     Running   0          35m
kube-system             kube-proxy-2wqk5                                            1/1     Running   0          35m
kube-system             kube-proxy-5fs6f                                            1/1     Running   0          35m               1/1     Running   0          23m
그라파나 접근은 다음과 같이 해주세요.
⌨️ kubectl patch svc kube-prometheus-stack-grafana -n kube-prometheus-stack -p '{"spec":{"type":"LoadBalancer"}}'

# EXternal IP 확인
⌨️ kubectl get svc -A | grep grafana
kube-prometheus-stack kube-prometheus-stack-grafana LoadBalancer 172.20.10.99 a766b12aaac1c4d3a93b8779f945aecb-1958566172.ap-northeast-2.elb.amazonaws.com 80:30926/TCP - 그라파나 접근 계정은 admin/admin1234 입니다.
Log 수집하기
Log 수집을 위해 ADoT 과 Loki 를 사용합니다.
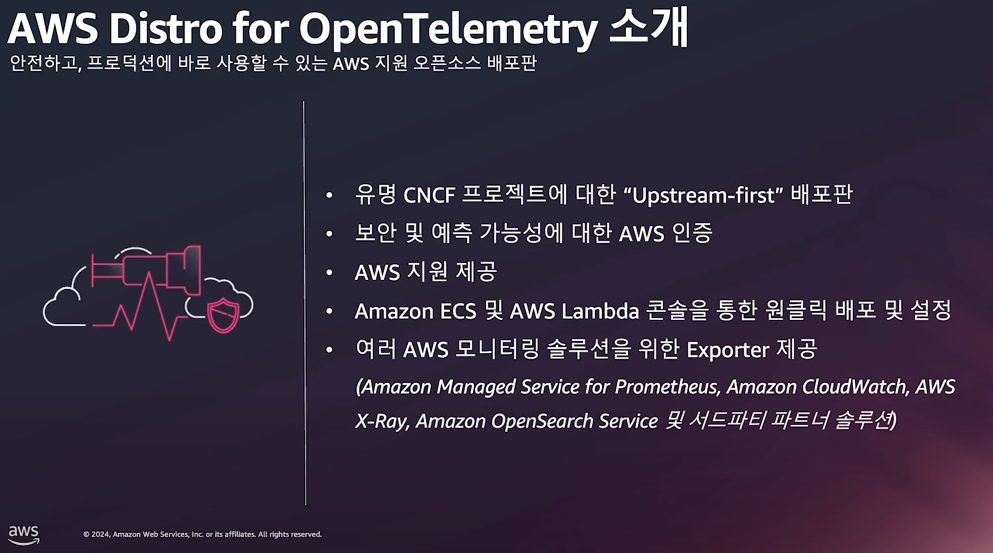
ADOT ?
- OpenTelemetry의 AWS 공식 배포판입니다.
- OpenTelemetry를 AWS 서비스와 원활하게 연동하도록 최적화되어있습니다.
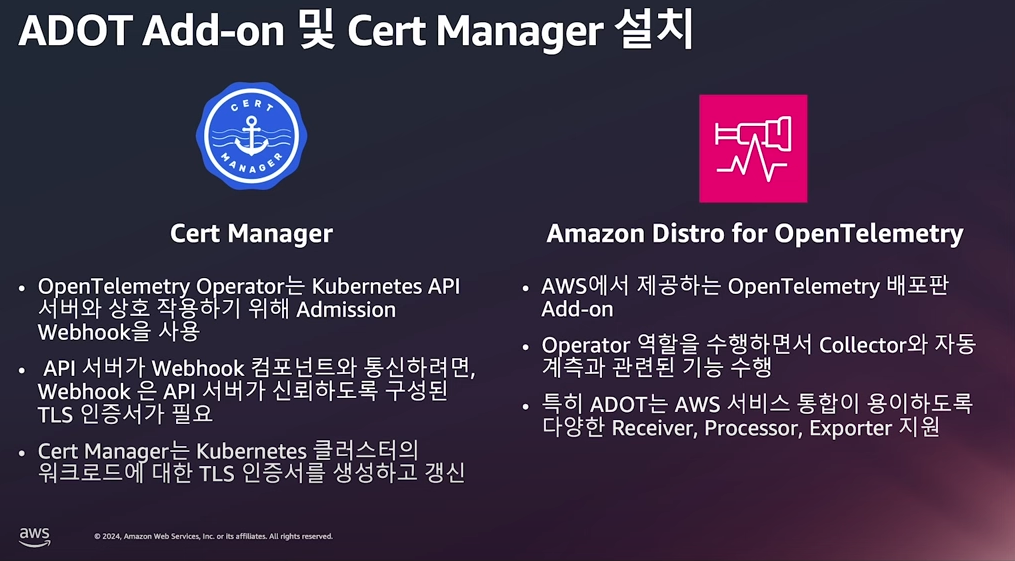
사전 구성
Cert Manager와 ADOT add-on을 먼저 설치해야 합니다.
- OpenTelemetry Operator가 Kubernetes API와 안전하게 통신하도록 TLS 인증서를 자동으로 관리하기 위해 Cert Manager를 추가
⌨️ helm repo add jetstack https://charts.jetstack.io
⌨️ helm repo update
⌨️ helm install cert-manager jetstack/cert-manager --namespace cert-manager --create-namespace --set installCRDs=true

⌨️ kubectl get pods -A
NAMESPACE               NAME                                                        READY   STATUS    RESTARTS   AGE
amazon-cloudwatch       aws-cloudwatch-metrics-5bvv5                                1/1     Running   0          95m
amazon-cloudwatch       aws-cloudwatch-metrics-7p5dl                                1/1     Running   0          95m
cert-manager            cert-manager-6794b8d569-cssjk                               1/1     Running   0          87m
cert-manager            cert-manager-cainjector-7f69cd69f7-kn448                    1/1     Running   0          87m
cert-manager            cert-manager-webhook-6cc5dccc4b-dnddl                       1/1     Running   0          87m
kube-prometheus-stack   kube-prometheus-stack-grafana-6f87cc6667-bfgmc              3/3     Running   0          14m
kube-prometheus-stack   kube-prometheus-stack-kube-state-metrics-7857ff9764-p7vf9   1/1     Running   0          14m
kube-prometheus-stack   kube-prometheus-stack-operator-857c7b8dd9-6j7gk             1/1     Running   0          14m
kube-prometheus-stack   kube-prometheus-stack-prometheus-node-exporter-62q2t        1/1     Running   0          14m
kube-prometheus-stack   kube-prometheus-stack-prometheus-node-exporter-ctfn7        1/1     Running   0          14m
kube-prometheus-stack   prometheus-kube-prometheus-stack-prometheus-0               2/2     Running   0          14m
kube-system             aws-load-balancer-controller-8bffc8f4-sdmnz                 1/1     Running   0          95m
kube-system             aws-load-balancer-controller-8bffc8f4-snsm7                 1/1     Running   0          95m
kube-system             aws-node-8x8ph                                              2/2     Running   0          95m
kube-system             aws-node-btnxs                                              2/2     Running   0          95m
kube-system             coredns-86f5954566-6x46d                                    1/1     Running   0          95m
kube-system             coredns-86f5954566-tp2pw                                    1/1     Running   0          96m
kube-system             ebs-csi-controller-6cf86f5ff5-4cw42                         6/6     Running   0          95m
kube-system             ebs-csi-controller-6cf86f5ff5-djt2t                         6/6     Running   0          95m
kube-system             ebs-csi-node-7hkkw                                          3/3     Running   0          95m
kube-system             ebs-csi-node-wxl99                                          3/3     Running   0          95m
kube-system             kube-proxy-2wqk5                                            1/1     Running   0          95m
kube-system             kube-proxy-5fs6f                                            1/1     Running   0          96m
# addon 전체 정보 확인
⌨️ aws eks describe-addon-versions \
--query 'sort_by(addons &owner)[].{publisher: publisher, owner: owner, addonName: addonName, type: type}' \
--output table
# ebs-csi-driver 호환 정보 확인
⌨️ aws eks describe-addon-versions \
--addon-name adot \
--kubernetes-version 1.31 \
--query "addons[].addonVersions[].[addonVersion, compatibilities[].defaultVersion]" \
--output text
# 클러스터 이름 변경
⌨️ aws eks create-addon --addon-name adot --addon-version v0.109.0-eksbuild.2 --cluster-name hsh-eks
kubectl get pods -A
⌨️ opentelemetry-operator-system opentelemetry-operator-5987b6f684-gll55 2/2 Running 0 16s Loki 및 Adot 배포
다음은 Loki 를 배포합니다.
⌨️ helm repo add grafana https://grafana.github.io/helm-charts
⌨️ helm repo update

⌨️ cat < loki.yaml
deploymentMode: "SingleBinary"

loki:
  commonConfig:
    replication_factor: 1
  storage:
    type: "filesystem"
  schemaConfig:
    configs:
    - from: "2024-04-01"
      store: "tsdb"
      object_store: "filesystem"
      schema: "v13"
      index:
        prefix: "loki_index_"
        period: "24h"
  auth_enabled: false

singleBinary:
  replicas: 1
backend:
  replicas: 0
read:
  replicas: 0
write:
  replicas: 0

gateway:
  enabled: false
chunksCache:
  enabled: false
resultsCache:
  enabled: false
lokiCanary:
  enabled: false

test:
  enabled: false
EOT


⌨️ kubectl create ns observability
⌨️ helm install loki grafana/loki \
  --namespace observability \
  --create-namespace \
  --version v6.6.3 \
  -f loki.yaml

⌨️ kubectl get pods -n observability
NAMESPACE                       NAME                                                        READY   STATUS    RESTARTS   AGE
observability                   loki-0                                                      1/1     Running   0          2m44s
로키에 로깅 정보를 푸쉬하기 위해 AWS Distro for OpenTelemetry (ADOT) Collector 를 구성합니다. Otel Collector 내부 아키텍처는 다음과 같습니다. (메트릭, 로깅, 트레이싱 수집 방법 동일)
- Receiver: 데이터를 수집하는 입력 단계
- Processor: 수집한 데이터를 변환, 필터링, 배치 처리하는 단계
- Exporter: 처리된 데이터를 외부 시스템으로 전송하는 출력 단계
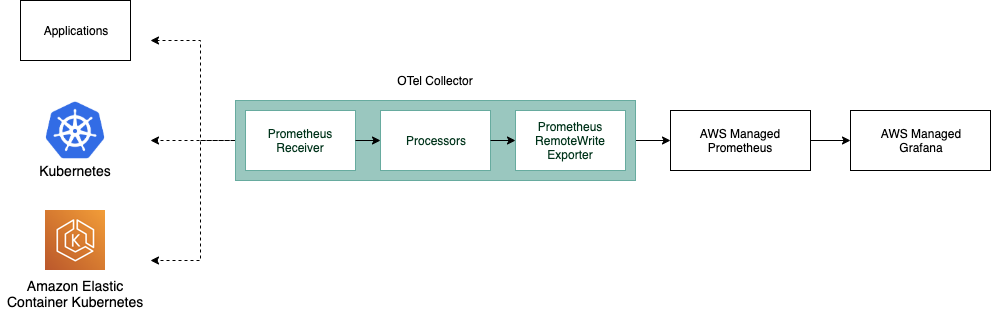
로깅 수집 Otel Collector 다음과 같이 정의됩니다.
- Receiver: /var/log/pods에 저장된 컨테이너 로그를 수집
- Processor: CRI-O, containerd, Docker 로그 포맷을 자동 인식하여 파싱
- Exporter: Loki (http://loki.observability:3100/otlp/v1/logs)에 전송
⌨️ export CLUSTER_NAME = "eks-hsh"

⌨️ cat << EOF > adot-obo-log-loki-collector.yaml
---
apiVersion: v1
kind: ServiceAccount
metadata:
  namespace: adot-collector
  name: adot-obo-log-loki

---
apiVersion: opentelemetry.io/v1alpha1
kind: OpenTelemetryCollector
metadata:
  namespace: adot-collector
  name: adot-obo-log-loki
spec:
  mode: daemonset
  serviceAccount: adot-obo-log-loki
  securityContext:
    runAsUser: 0
    runAsGroup: 0
  hostNetwork: false
  resources:
    limits:
      cpu: 200m
      memory: 400Mi
    requests:
      cpu: 200m
      memory: 400Mi

  env:
  - name: CLUSTER_NAME
    value: eks-adot-ob-eks
  - name: K8S_NODE_NAME
    valueFrom:
      fieldRef:
        fieldPath: spec.nodeName
  - name: HOST_IP
    valueFrom:
      fieldRef:
        fieldPath: status.hostIP
  - name: HOST_NAME
    valueFrom:
      fieldRef:
        fieldPath: spec.nodeName
  - name: K8S_NAMESPACE
    valueFrom:
       fieldRef:
         fieldPath: metadata.namespace

  volumes:
  - name: rootfs
    hostPath:
      path: /
  - name: dockersock
    hostPath:
      path: /var/run/docker.sock
  - name: varlibdocker
    hostPath:
      path: /var/lib/docker
  - name: containerdsock
    hostPath:
      path: /run/containerd/containerd.sock
  - name: sys
    hostPath:
      path: /sys
  - name: devdisk
    hostPath:
      path: /dev/disk/
  - name: varlogpods
    hostPath:
      path: /var/log/pods

  volumeMounts:
  - name: rootfs
    mountPath: /rootfs
    readOnly: true
  - name: dockersock
    mountPath: /var/run/docker.sock
    readOnly: true
  - name: containerdsock
    mountPath: /run/containerd/containerd.sock
  - name: varlibdocker
    mountPath: /var/lib/docker
    readOnly: true
  - name: sys
    mountPath: /sys
    readOnly: true
  - name: devdisk
    mountPath: /dev/disk
    readOnly: true
  - name: varlogpods
    mountPath: /var/log/pods
    readOnly: true

  config: |
    extensions:
      health_check:

    receivers:
      filelog:
        include:
        - /var/log/pods/*/*/*.log
        exclude:
        # Exclude logs from all containers named otel-collector
        - /var/log/pods/*/otc-container/*.log
        start_at: beginning
        include_file_path: true
        include_file_name: false
        operators:
        # Find out which format is used by kubernetes
        - type: router
          id: get-format
          routes:
          - output: parser-docker
            expr: 'body matches "^\\\\{"'
          - output: parser-crio
            expr: 'body matches "^[^ Z]+ "'
          - output: parser-containerd
            expr: 'body matches "^[^ Z]+Z"'
        # Parse CRI-O format
        - type: regex_parser
          id: parser-crio
          regex:
            '^(?P<time>[^ Z]+) (?P<stream>stdout|stderr) (?P<logtag>[^ ]*)
            ?(?P<log>.*)$'
          output: extract_metadata_from_filepath
          timestamp:
            parse_from: attributes.time
            layout_type: gotime
            layout: '2006-01-02T15:04:05.999999999Z07:00'
        # Parse CRI-Containerd format
        - type: regex_parser
          id: parser-containerd
          regex:
            '^(?P<time>[^ ^Z]+Z) (?P<stream>stdout|stderr) (?P<logtag>[^ ]*)
            ?(?P<log>.*)$'
          output: extract_metadata_from_filepath
          timestamp:
            parse_from: attributes.time
            layout: '%Y-%m-%dT%H:%M:%S.%LZ'
        # Parse Docker format
        - type: json_parser
          id: parser-docker
          output: extract_metadata_from_filepath
          timestamp:
            parse_from: attributes.time
            layout: '%Y-%m-%dT%H:%M:%S.%LZ'
        - type: move
          from: attributes.log
          to: body
        # Extract metadata from file path
        - type: regex_parser
          id: extract_metadata_from_filepath
          regex: '^.*\\/(?P<namespace>[^_]+)_(?P<pod_name>[^_]+)_(?P<uid>[a-f0-9\\-]{36})\\/(?P<container_name>[^\\._]+)\\/(?P<restart_count>\\d+)\\.log$'
          parse_from: attributes["log.file.path"]
          cache:
            size: 128 # default maximum amount of Pods per Node is 110
        # Rename attributes
        - type: move
          from: attributes.stream
          to: attributes["log.iostream"]
        - type: move
          from: attributes.container_name
          to: resource["k8s.container.name"]
        - type: move
          from: attributes.namespace
          to: resource["k8s.namespace.name"]
        - type: move
          from: attributes.pod_name
          to: resource["k8s.pod.name"]
        - type: move
          from: attributes.restart_count
          to: resource["k8s.container.restart_count"]
        - type: add
          value: \$CLUSTER_NAME
          field: resource["k8s.cluster.name"]

    processors:
      batch/logs:

    exporters:
      otlphttp:
        logs_endpoint: "http://loki.observability:3100/otlp/v1/logs"
        compression: none

    service:
      extensions: [health_check]
      pipelines:
        logs:
          receivers: [filelog]
          processors: [batch/logs]
          exporters: [otlphttp]
EOF


⌨️ kubectl create ns
⌨️ kubectl apply -f adot-obo-log-loki-collector.yaml

⌨️ kubectl get pods -n adot-collector
NAMESPACE                       NAME                                                        READY   STATUS    RESTARTS   AGE
adot-collector                  adot-obo-log-loki-collector-lb48l                           1/1     Running   0          2m59s
adot-collector                  adot-obo-log-loki-collector-pcx8h                           1/1     Running   0          2m59s
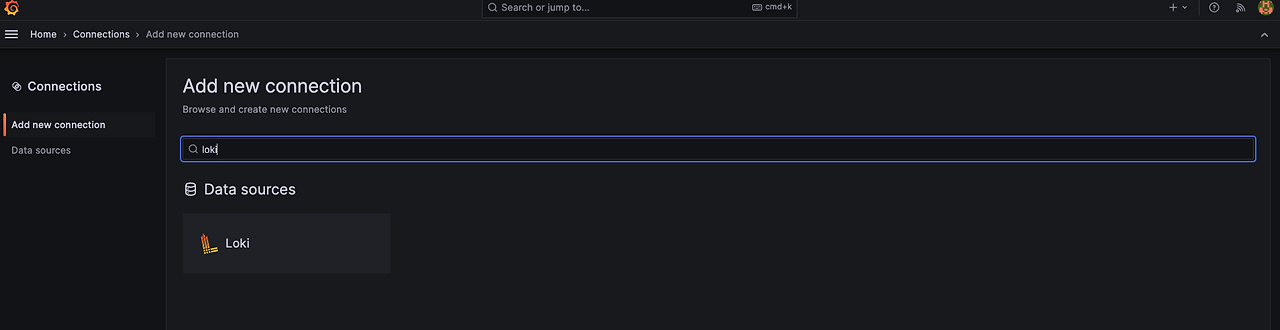
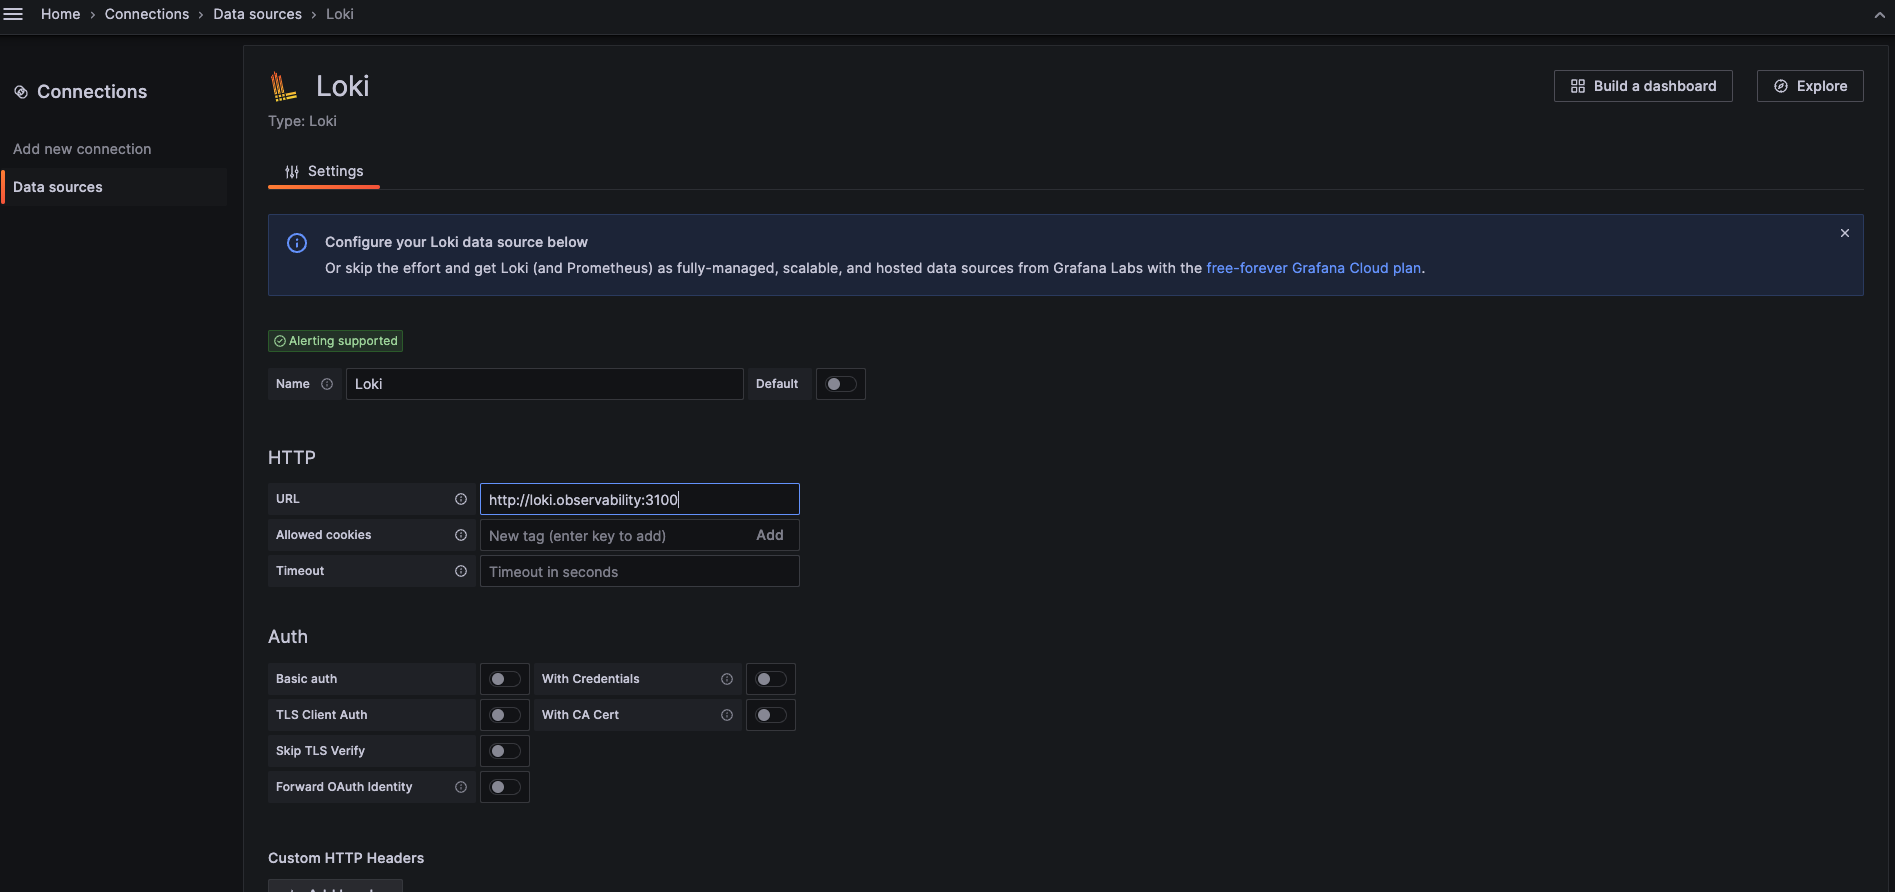
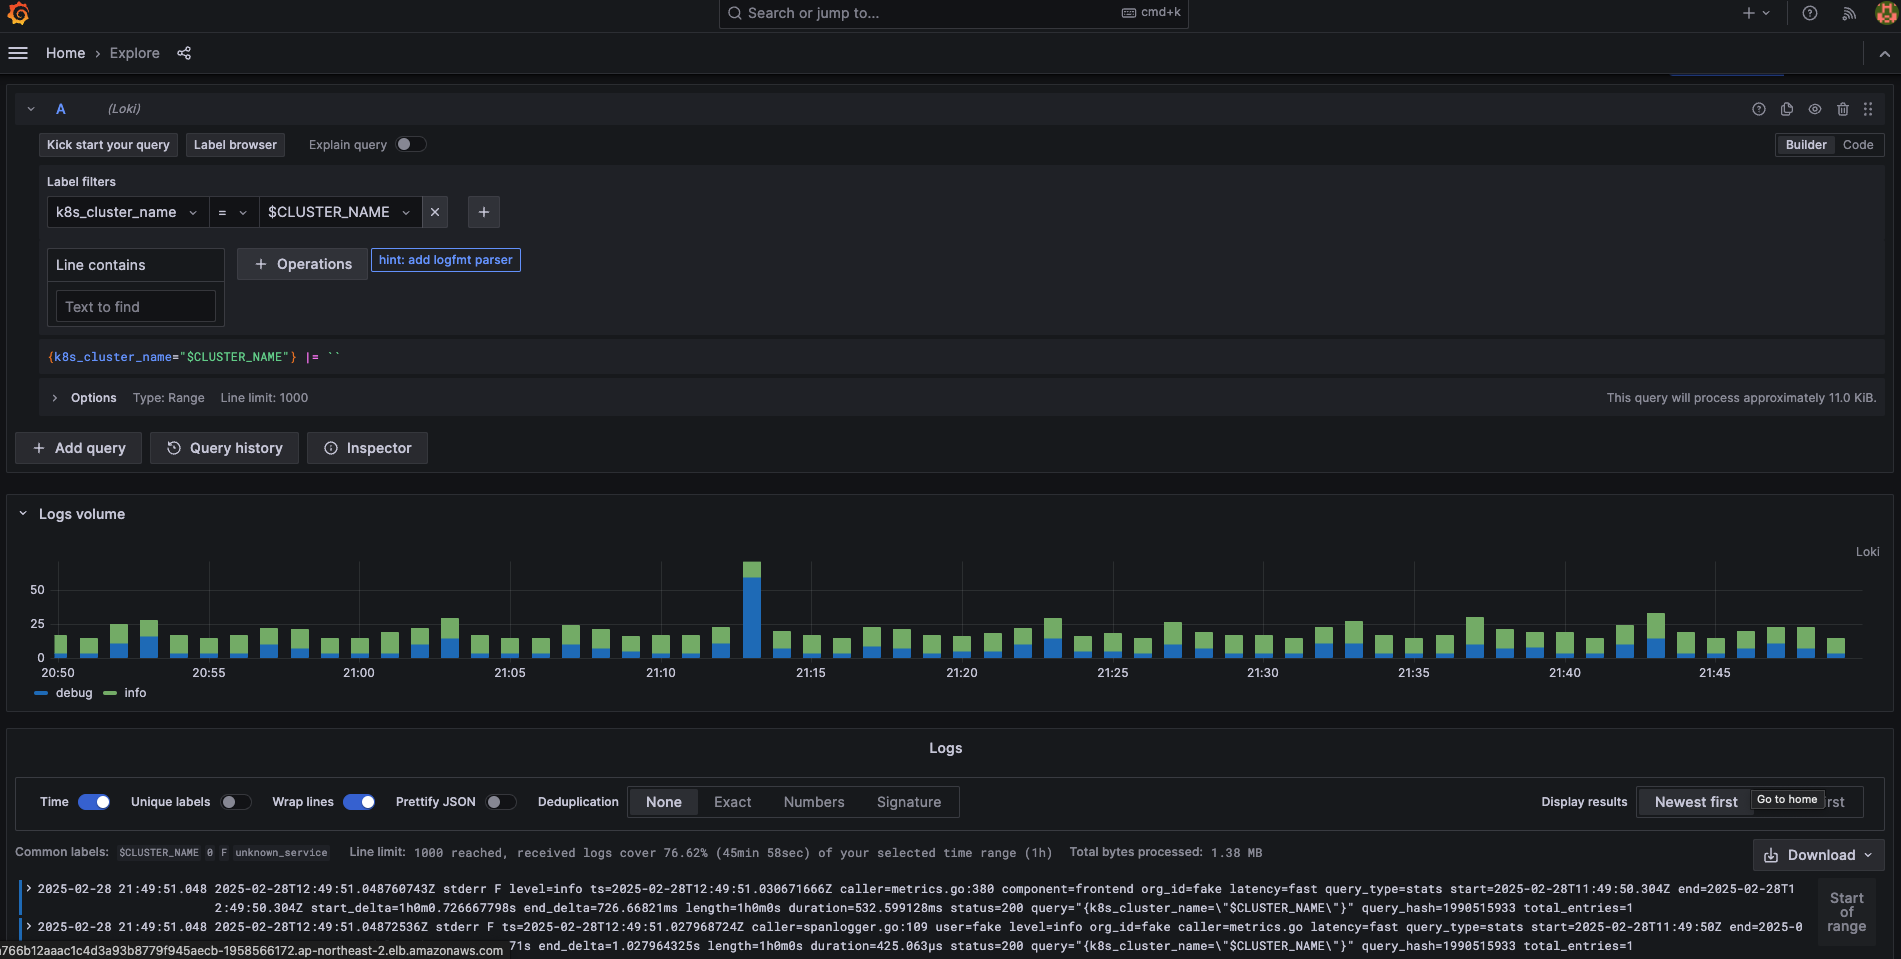
그라파나 내 로그 설정
그라파나에서 로깅 Exporter 를 등록하여 로깅 정보를 가져오겠습니다.
- Connections > Add New Connection > “loki”
- URL : http://loki.observability:3100
- Expolore > Loki 에서 라벨 필터로 로그 확인
트레이스 수집하기
로깅과 마찬가지로 Grafana 재단에서 개발한 Tempo를 통해 트레이스를 수집하고, 수집에이전트는 ADOT를 통해 데이터를 수집하겠습니다.
사전 구성
- Cert Manager와 ADOT add-on 설치 (위 로깅 문단 참고)
Tempo 및 Trace 배포
Tempo 배포
⌨️ helm repo add grafana https://grafana.github.io/helm-charts
⌨️ helm repo update

⌨️ cat < tempo.yaml
replicas: 1
EOT


⌨️ helm install tempo grafana/tempo \
  --namespace observability \
  --create-namespace \
  -f tempo.yaml \
  --version v1.7.1

⌨️ kubectl get pods -n observability
NAME      READY   STATUS    RESTARTS   AGE
loki-0    1/1     Running   0          151m
tempo-0   1/1     Running   0          27s
ADOT Trace Collector 배포
- Receiver: OpenTelemetry 자동 instrumentation을 통해 애플리케이션의 추적 데이터를 수집
- Processor: 추적 데이터를 sampler를 통해 샘플링하여 추적할 데이터를 필터링 (여기서는 모든 트랜잭션에 대해 추적을 수집하는 설정)
- Exporter: Tempo (http://adot-obo-trace-tempo-collector.adot-collector.svc.cluster.local:4318)에 추적 데이터를 전송
⌨️ export CLUSTER_NAME = "hsh-eks"

⌨️ cat << EOF > adot-obo-trace-tempo-collector.yaml
---
apiVersion: v1
kind: ServiceAccount
metadata:
  namespace: adot-collector
  name: adot-obo-trace-tempo

---
apiVersion: opentelemetry.io/v1alpha1
kind: OpenTelemetryCollector
metadata:
  namespace: adot-collector
  name: adot-obo-trace-tempo
spec:
  mode: deployment
  replicas: 1
  serviceAccount: adot-obo-trace-tempo
  resources:
    limits:
      cpu: 200m
      memory: 400Mi
    requests:
      cpu: 200m
      memory: 400Mi

  env:
  - name: CLUSTER_NAME
    value: eks-adot-ob-eks

  config: |
    extensions:
      health_check:

    receivers:
      otlp:
        protocols:
          grpc:
            endpoint: 0.0.0.0:4317
          http:
            endpoint: 0.0.0.0:4318

    exporters:
      otlphttp:
        endpoint: http://tempo.observability:4318
        tls:
          insecure: true

    processors:
      batch/traces:
        timeout: 1s
        send_batch_size: 50
      resource:
        attributes:
        - key: k8s.cluster.name
          value: \$CLUSTER_NAME
          action: insert

    service:
      extensions: [health_check]
      pipelines:
        traces:
          receivers: [otlp]
          processors: [batch/traces, resource]
          exporters: [otlphttp]
EOF

⌨️ kubectl apply -f adot-obo-trace-tempo-collector.yaml

⌨️ kubectl -n adot-collector get pod | grep adot-obo-trace-tempo
adot-obo-trace-tempo-collector-5f57c9d9cd-w8j68   1/1     Running   0          58s
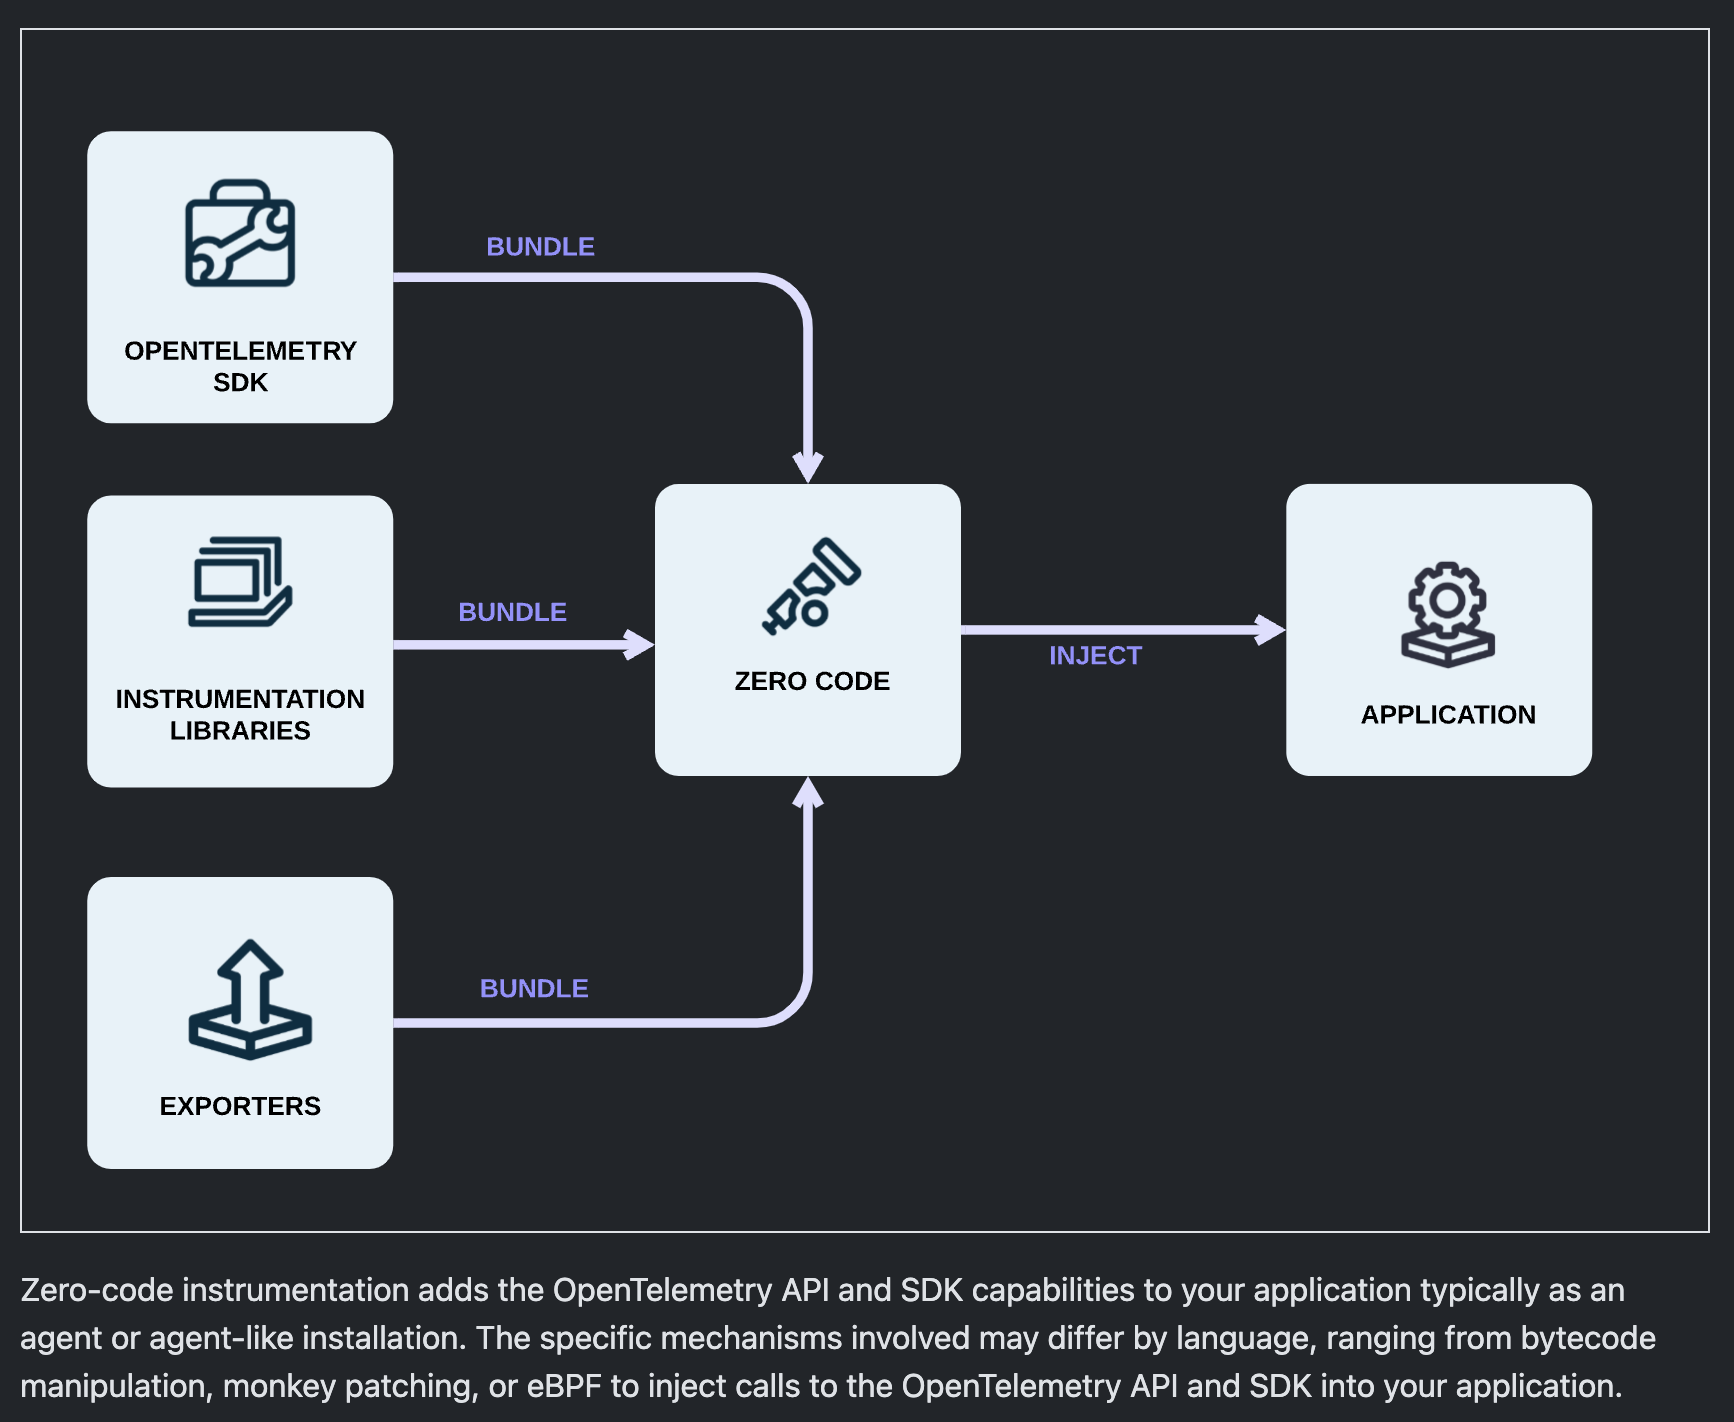
ADOT Trace Instrumentation 배포
Instrumentation는 opentelemetry가 제공하는 auto instrumentation 기능으로
애플리케이션의 소스 코드를 수정하지 않고도 자동으로 트레이싱 데이터를 수집할 수 있습니다.
정확히는 opentelemetry-operator 가 파드 주입(pod injection)을 통해 트레이싱 데이터를 수집합니다.
⌨️ kubectl create ns app

⌨️ cat << EOF > adot-obo-trace-tempo-instrumentation.yaml
apiVersion: opentelemetry.io/v1alpha1
kind: Instrumentation
metadata:
  name: adot-obo-trace-tempo-instrumentation
  namespace: app
spec:
  exporter:
    endpoint: http://adot-obo-trace-tempo-collector.adot-collector.svc.cluster.local:4318
  propagators:
  - tracecontext
  - baggage
  sampler:
    type: parentbased_traceidratio
    argument: "1"
  python:
    # temp
    image: ghcr.io/open-telemetry/opentelemetry-operator/autoinstrumentation-python:0.51b0
    env:
    - name: OTEL_METRICS_EXPORTER
      value: none
EOF


⌨️ kubectl apply -f adot-obo-trace-tempo-instrumentation.yaml
예제 애플리케이션 배포
⌨️ cat << EOF > my-app.yaml
---
apiVersion: v1
kind: Namespace
metadata:
  name: app

---
apiVersion: apps/v1
kind: Deployment
metadata:
  namespace: app
  name: app-python
spec:
  selector:
    matchLabels:
      app: app-python
  replicas: 2
  template:
    metadata:
      labels:
        app: app-python
    spec:
      containers:
      - name: app-python
        image: ghcr.io/ssup2-playground/eks-adot-app-python:0.2
        ports:
        - containerPort: 80
        livenessProbe:
          httpGet:
            path: /healthz
            port: 80
          periodSeconds: 60
        readinessProbe:
          httpGet:
            path: /healthz
            port: 80
          periodSeconds: 60
  strategy:
    type: RollingUpdate
    rollingUpdate:
      maxSurge: 0%
      maxUnavailable: 100%

---
apiVersion: v1
kind: Service
metadata:
  namespace: app
  name: app-python
  annotations:
    service.beta.kubernetes.io/aws-load-balancer-type: "external"
    service.beta.kubernetes.io/aws-load-balancer-scheme: "internet-facing"
    service.beta.kubernetes.io/aws-load-balancer-nlb-target-type: "ip"
spec:
  type: LoadBalancer
  selector:
    app: app-python
  ports:
  - protocol: TCP
    port: 80
    targetPort: 80
EOF

⌨️ kubectl apply -f my-app.yaml

# 파드에 instrumentation 주입
⌨️ kubectl -n app patch deployment app-python -p '{"spec":{"template":{"metadata":{"annotations":{"instrumentation.opentelemetry.io/inject-python": "true"}}}}}'
# 파드 재시작
⌨️ kubectl -n app rollout restart deployment app-python
# 파드 주입 확인
⌨️ kubectl -n app describe pod | grep "Init Containers" -A 4
Init Containers:
  opentelemetry-auto-instrumentation-python:
    Container ID:  containerd://4ec43d2197b75ff871569af076b1eccc9df63a0b727b523ef29a79d667f6fac0
    Image:         ghcr.io/open-telemetry/opentelemetry-operator/autoinstrumentation-python:0.51b0
    Image ID:      ghcr.io/open-telemetry/opentelemetry-operator/autoinstrumentation-python@sha256:ba468b26e24c461110e299f3d6121583ed6885b749f49a8a9cb1eb1c412c8819
--
Init Containers:
  opentelemetry-auto-instrumentation-python:
    Container ID:  containerd://142bcfe9b61bc5e6634e8786a661d856eb17867a3775e7d4f855a54a57f3b78d
    Image:         ghcr.io/open-telemetry/opentelemetry-operator/autoinstrumentation-python:0.51b0
    Image ID:      ghcr.io/open-telemetry/opentelemetry-operator/autoinstrumentation-python@sha256:ba468b26e24c461110e299f3d6121583ed6885b749f49a8a9cb1eb1c412c8819
애플리케이션 코드를 확인하면 트레이싱을 위한 SDK 설치가 없는 것을 확인할 수 있습니다.
⌨️ docker pull ghcr.io/ssup2-playground/eks-adot-app-python:0.2

⌨️ docker run -it --rm --name eks-adot-app ghcr.io/ssup2-playground/eks-adot-app-python:0.2 /bin/sh

⌨️ ls -al
drwxr-xr-x 1 root root 4096 Jun  6  2024 .
drwxr-xr-x 1 root root 4096 Feb 28 19:05 ..
-rw-r--r-- 1 root root   49 Jun  6  2024 requirements.txt
-rw-r--r-- 1 root root  616 Jun  6  2024 run.py

⌨️ cat run.py
import logging
import time

from fastapi import FastAPI

app = FastAPI()

# Ping handlers
@app.get("/ping")
async def get_ping():
    logging.info("pong")
    return {"message": "pong"}

@app.get("/pingsleep5s")
async def get_pingsleep5():
    time.sleep(5)
    logging.info("pong sleep 5s")
    return {"message": "pong sleep 5s"}

@app.get("/pingsleep10s")
async def get_pingsleep10():
    time.sleep(10)
    logging.info("pong sleep 10s")
    return {"message": "pong sleep 10s"}

# Health handlers
@app.get("/healthz")
def get_heatlhz() -> dict[str, str]:
    logging.info("healthz")
    return {"status": "up"}
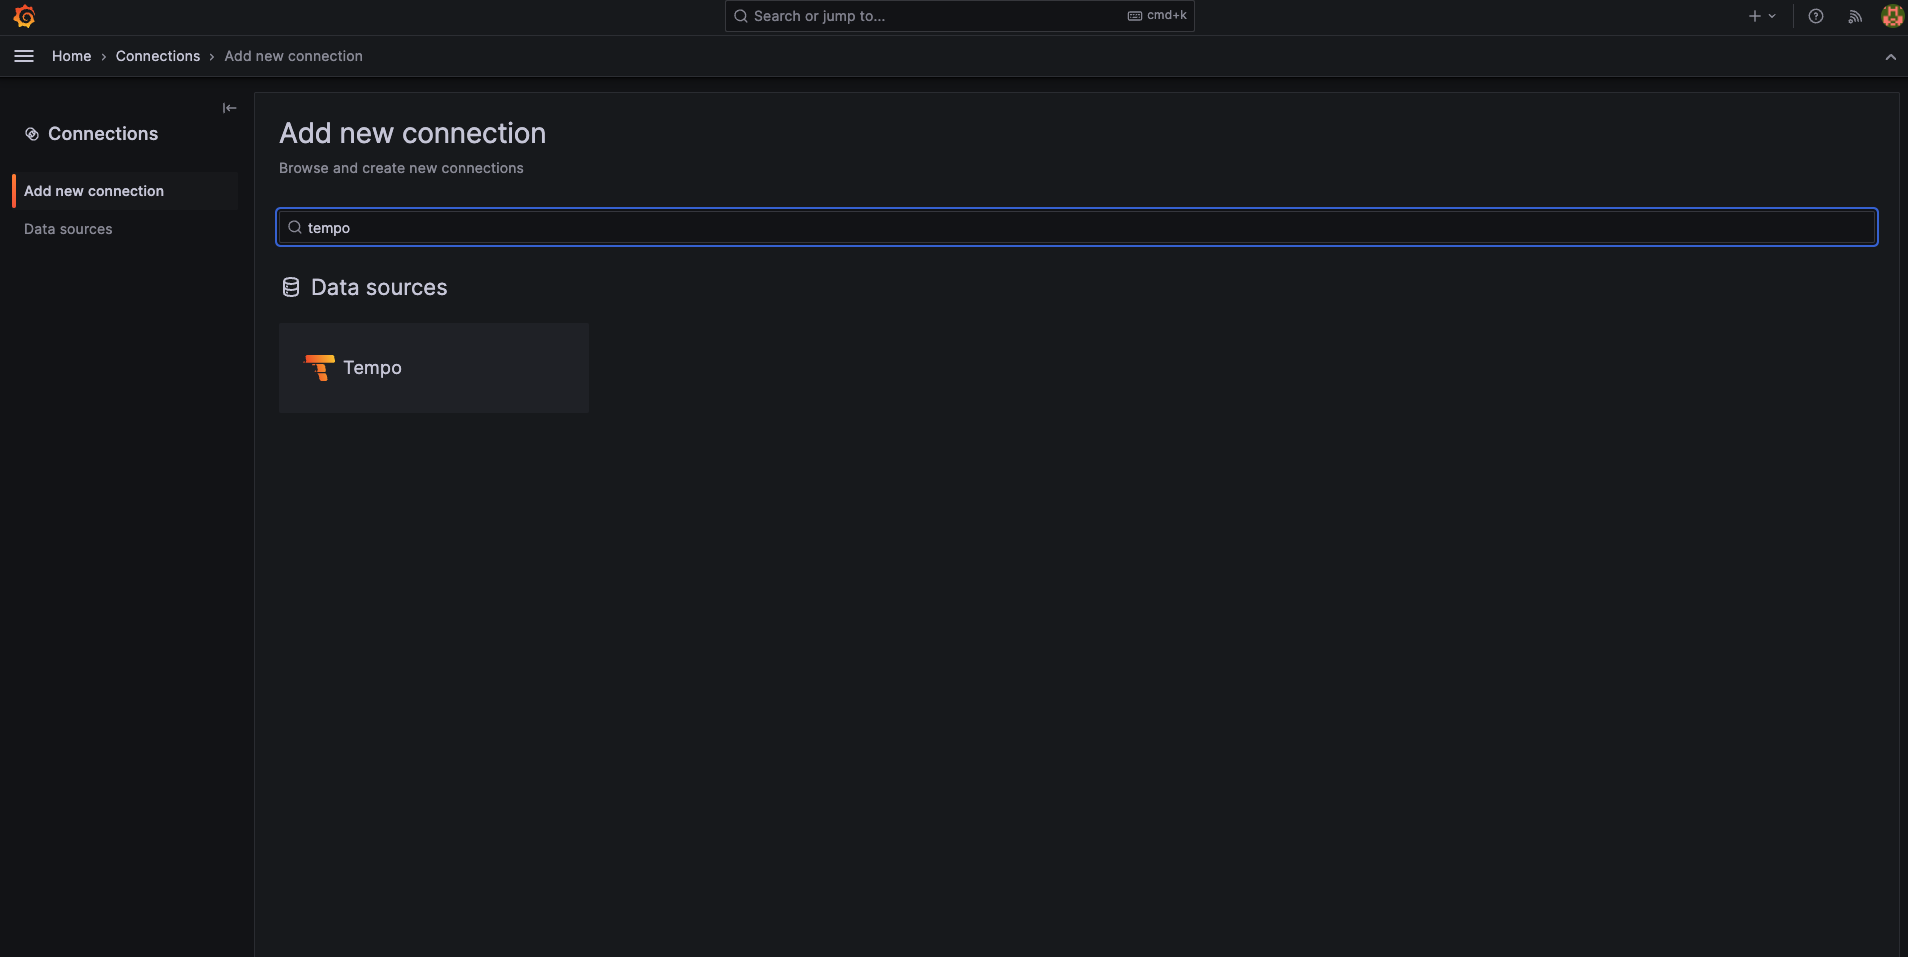
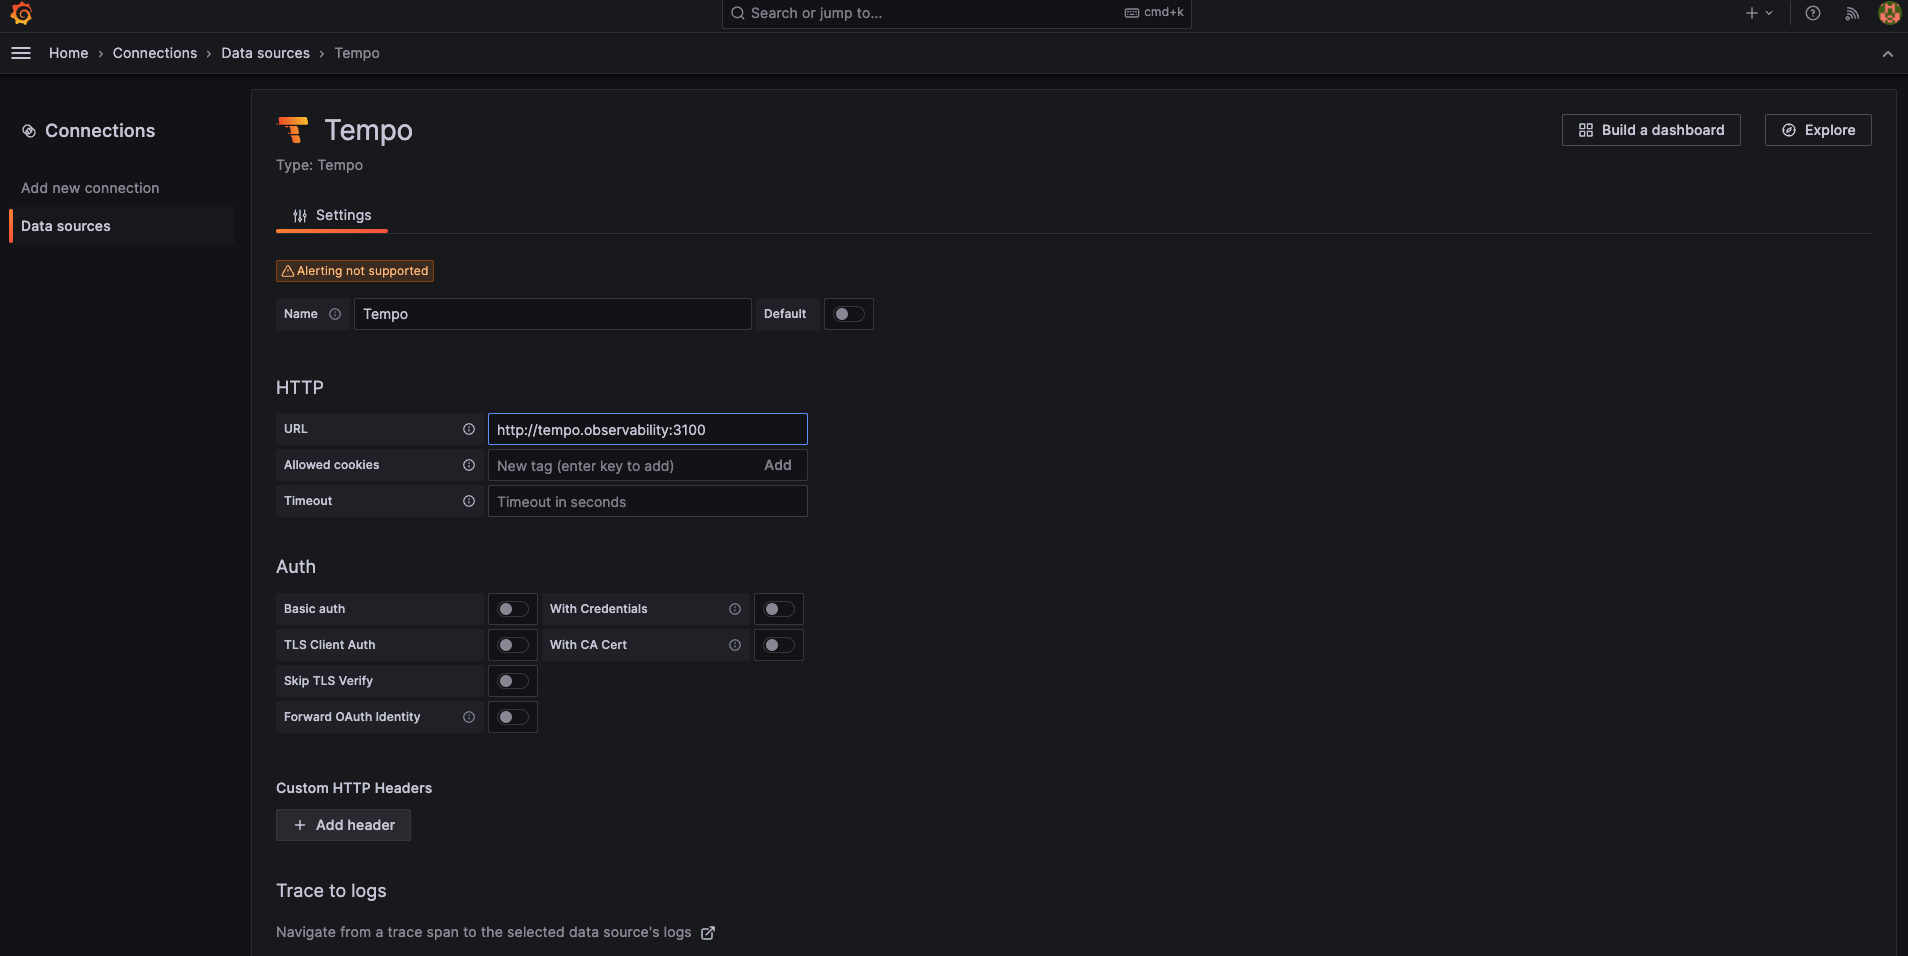
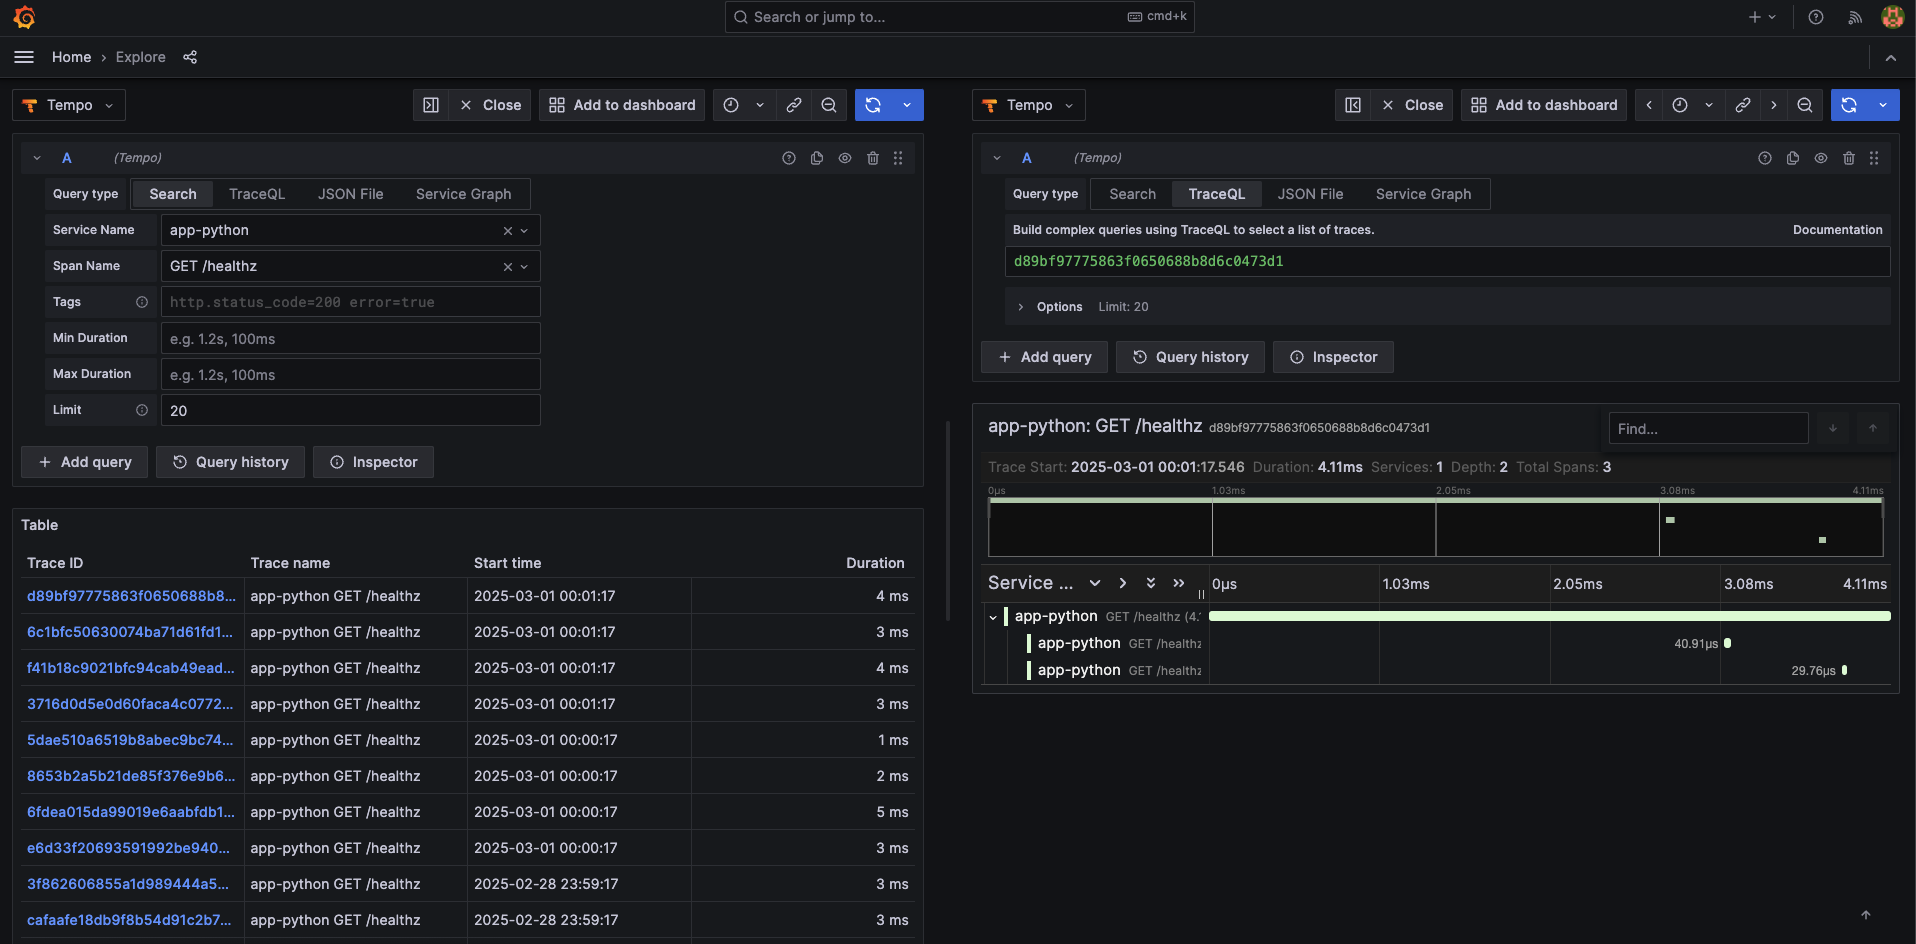
그라파나 내 트레이싱 설정
그라파나에서 Tempo Exporter 를 등록하여 트레이싱 정보를 가져오겠습니다.
- Connections > Add New Connection > “loki”
- URL : http://tempo.observability:3100
- Explore > Tempo > 쿼리로 위 배포한 python 앱을 지정하여 확인
자원 정리
./cleanup.sh 참고
도서 모니터링의 새로운 미래 관측 가능성
https://www.youtube.com/watch?v=jYDZJGhzmU0
'Cloud' 카테고리의 다른 글
| EKS Karpenter (0) | 2025.03.09 |
|---|---|
| EKS Autoscaling (0) | 2025.03.09 |
| EKS 노드 그룹 (1) | 2025.02.23 |
| EBS CSI Controller 정리 (1) | 2025.02.23 |
| Kubeflow 구성 비용 최소화 및 대시보드 구성기(feat. JuJu) (1) | 2025.02.16 |