본 블로그 글은 CloudNet@ 가시다님이 진행하는 스터디, AEWS3기에서 참고하였습니다.
Auto Scaling 개요
기본 확장 방식
|
확장 유형
|
설명
|
장점
|
단점
|
|
수평 확장 (Horizontal Scaling)
|
워크로드(Pod, VM)를 추가하여 확장
|
유연성 높음, 비용 효율적
|
네트워크 부하 분산 필요
|
|
수직 확장 (Vertical Scaling)
|
기존 워크로드의 성능(CPU, RAM) 증가
|
빠른 성능 향상 가능
|
하드웨어 한계, 장애 위험
|
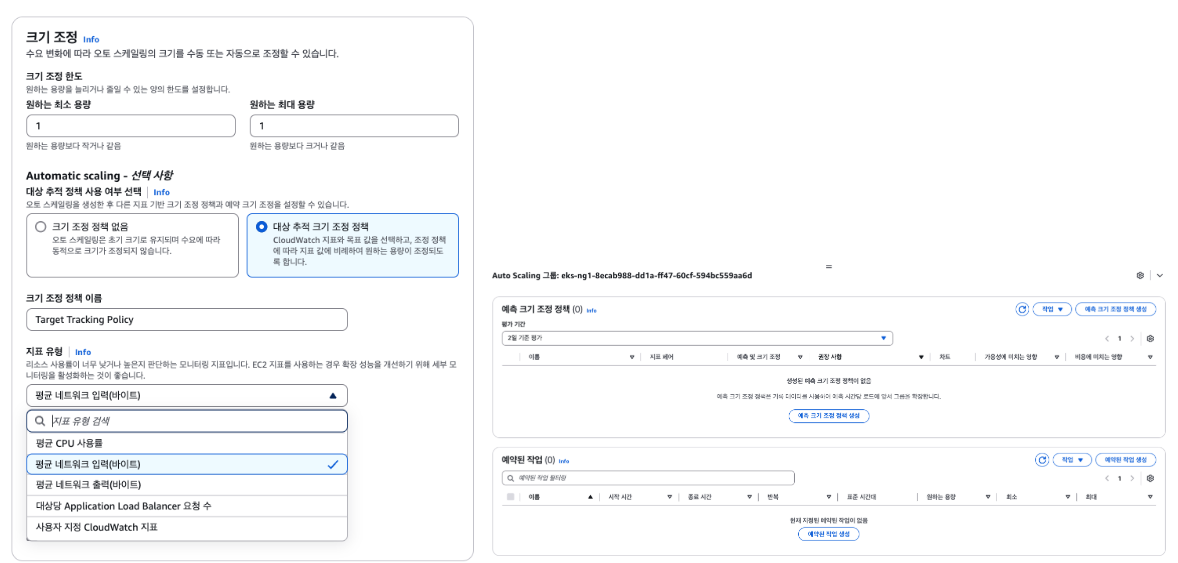
AWS Auto Scaling 정책
|
정책
|
유형
|
설명
|
|
Simple/Step Scaling
|
Manual Reactive
|
사용자가 설정한 임계값을 초과할 경우 단계별 확장
|
|
Target Tracking Scaling
|
Automated Reactive
|
특정 메트릭을 유지하도록 자동 확장
|
|
Scheduled Scaling
|
Manual Proactive
|
정해진 일정에 맞춰 확장
|
|
Predictive Scaling
|
Automated Proactive
|
과거 트렌드 기반으로 예측적 확장
|
EKS Auto Scaling 도구
|
도구
|
설명
|
확장 방식
|
|
HPA (Horizontal Pod Autoscaler)
|
CPU/메모리 기반으로 파드 개수 조정
|
수평적 확장 (Pods Scale Out)
|
|
VPA (Vertical Pod Autoscaler)
|
파드 리소스(CPU, 메모리) 자동 조정
|
수직적 확장 (Pods Scale Up)
|
|
CAS (Cluster Autoscaler)
|
노드 부족 시 자동으로 노드 추가
|
수평적 확장 (Nodes Scale Out)
|
|
Karpenter
|
Unscheduled 파드가 있을 경우 최적화된 노드 프로비저닝
|
수평/수직 확장 (Nodes Scale Up/Out)
|
실습 환경 구성
# YAML 파일 다운로드
curl -O https://s3.ap-northeast-2.amazonaws.com/cloudformation.cloudneta.net/K8S/myeks-5week.yaml

# 변수 지정
CLUSTER_NAME=hsh-eks
SSHKEYNAME=
MYACCESSKEY=
MYSECRETKEY=

# CloudFormation 스택 배포
aws cloudformation deploy --template-file myeks-5week.yaml --stack-name $CLUSTER_NAME --parameter-overrides KeyName=$SSHKEYNAME SgIngressSshCidr=$(curl -s ipinfo.io/ip)/32  MyIamUserAccessKeyID=$MYACCESSKEY MyIamUserSecretAccessKey=$MYSECRETKEY ClusterBaseName=$CLUSTER_NAME --region ap-northeast-2

# CloudFormation 스택 배포 완료 후 작업용 EC2 IP 출력
aws cloudformation describe-stacks --stack-name $CLUSTER_NAME --query 'Stacks[*].Outputs[0].OutputValue' --output text- EKS 배포에 약 20분정도 소요됩니다.
실습 환경 구성시 베스천 서버에 실습 구성을 위한 도구가 설치됩니다.
- Kubecolor - kubectl 출력에 색상을 추가하는 도구
- Kind - 로컬에서 Kubernetes 클러스터를 실행하는 도구
- eks-node-viewer - EKS 노드 상태 시각화 도구
- VPA - 쿠버네티스에서 Pod의 리소스를 자동으로 조정하는 도구
vi myeks-5week.yaml
...

# Install krew
curl -L https://github.com/kubernetes-sigs/krew/releases/download/v0.4.4/krew-linux_amd64.tar.gz -o /root/krew-linux_amd64.tar.gz
tar zxvf krew-linux_amd64.tar.gz
./krew-linux_amd64 install krew
export PATH="$PATH:/root/.krew/bin"
echo 'export PATH="$PATH:/root/.krew/bin:/root/go/bin"' >> /etc/profile

# Install krew plugin
kubectl krew install ctx ns get-all neat df-pv stern oomd view-secret # ktop tree

# Install Docker & Docker-compose
amazon-linux-extras install docker -y
systemctl start docker && systemctl enable docker
curl -L "https://github.com/docker/compose/releases/latest/download/docker-compose-$(uname -s)-$(uname -m)" -o /usr/local/bin/docker-compose
chmod +x /usr/local/bin/docker-compose

# Install Kubecolor
wget https://github.com/kubecolor/kubecolor/releases/download/v0.5.0/kubecolor_0.5.0_linux_amd64.tar.gz
tar -zxvf kubecolor_0.5.0_linux_amd64.tar.gz
mv kubecolor /usr/local/bin/

# Install Kind
curl -Lo ./kind https://kind.sigs.k8s.io/dl/v0.27.0/kind-linux-amd64
chmod +x ./kind
mv ./kind /usr/local/bin/kind

# Install eks-node-viewer
yum install golang -y
go install github.com/awslabs/eks-node-viewer/cmd/eks-node-viewer@latest

# git clone VPA
git clone https://github.com/kubernetes/autoscaler.git
예제 배포를 위해 Addon을 배포하겠습니다.
# AWS LoadBalancerController
helm repo add eks https://aws.github.io/eks-charts
helm install aws-load-balancer-controller eks/aws-load-balancer-controller -n kube-system --set clusterName=$CLUSTER_NAME \
  --set serviceAccount.create=false --set serviceAccount.name=aws-load-balancer-controller

# ExternalDNS
MyDomain=sub.horang.link
echo $MyDomain
MyDnzHostedZoneId=$(aws route53 list-hosted-zones-by-name --dns-name "$MyDomain." --query "HostedZones[0].Id" --output text)
curl -s https://raw.githubusercontent.com/gasida/PKOS/main/aews/externaldns.yaml | MyDomain=$MyDomain MyDnzHostedZoneId=$MyDnzHostedZoneId envsubst | kubectl apply -f -

# gp3 스토리지 클래스 생성
cat <https://geek-cookbook.github.io/charts/
helm install kube-ops-view geek-cookbook/kube-ops-view --version 1.2.2 --set service.main.type=ClusterIP  --set env.TZ="Asia/Seoul" --namespace kube-system

# kubeopsview 용 Ingress 설정 : group 설정으로 1대의 ALB를 여러개의 ingress 에서 공용 사용
echo $CERT_ARN
cat <        443/TCP                  87m
service/eks-extension-metrics-api           ClusterIP   10.100.107.21            443/TCP                  3h28m
service/kube-dns                            ClusterIP   10.100.0.10              53/UDP,53/TCP,9153/TCP   3h24m
service/kube-ops-view                       ClusterIP   10.100.90.148            8080/TCP                 4m3s
service/metrics-server                      ClusterIP   10.100.124.243           443/TCP                  3h24m

NAME                                          ENDPOINTS                                                    AGE
endpoints/aws-load-balancer-webhook-service   192.168.1.92:9443,192.168.2.90:9443                          87m
endpoints/eks-extension-metrics-api           172.0.32.0:10443                                             3h28m
endpoints/kube-dns                            192.168.1.5:53,192.168.3.215:53,192.168.1.5:53 + 3 more...   3h24m
endpoints/kube-ops-view                       192.168.1.109:8080                                           4m3s
endpoints/metrics-server                      192.168.2.216:10251,192.168.3.5:10251                        3h24m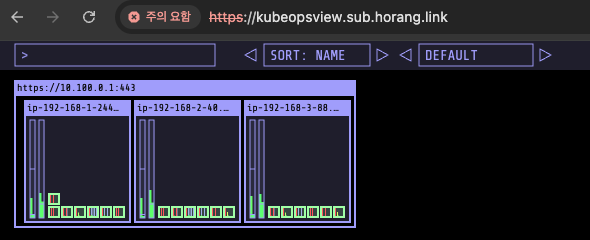
프로메테우스 스택은 스터디를 위해 다음과 같이 구성합니다.
- PV/PVC 미사용 : EBS 수동 삭제 필요하여 미사용
- VPA 활성화 및 VPA 커스텀 메트릭 수집 설정 : memory, cpu 리소스 추천 값을 Prometheus에서 조회하도록 설정
helm repo add prometheus-community https://prometheus-community.github.io/helm-charts


cat < monitor-values.yaml
prometheus:
  prometheusSpec:
    scrapeInterval: "15s"
    evaluationInterval: "15s"
    podMonitorSelectorNilUsesHelmValues: false
    serviceMonitorSelectorNilUsesHelmValues: false
    retention: 5d
    retentionSize: "10GiB"

  # Enable vertical pod autoscaler support for prometheus-operator
  verticalPodAutoscaler:
    enabled: true

  ingress:
    enabled: true
    ingressClassName: alb
    hosts:
      - prometheus.$MyDomain
    paths:
      - /*
    annotations:
      alb.ingress.kubernetes.io/scheme: internet-facing
      alb.ingress.kubernetes.io/target-type: ip
      alb.ingress.kubernetes.io/listen-ports: '[{"HTTPS":443}, {"HTTP":80}]'
      alb.ingress.kubernetes.io/certificate-arn: $CERT_ARN
      alb.ingress.kubernetes.io/success-codes: 200-399
      alb.ingress.kubernetes.io/load-balancer-name: hsh-eks-ingress-alb
      alb.ingress.kubernetes.io/group.name: study
      alb.ingress.kubernetes.io/ssl-redirect: '443'

grafana:
  defaultDashboardsTimezone: Asia/Seoul
  adminPassword: prom-operator
  defaultDashboardsEnabled: false

  ingress:
    enabled: true
    ingressClassName: alb
    hosts:
      - grafana.$MyDomain
    paths:
      - /*
    annotations:
      alb.ingress.kubernetes.io/scheme: internet-facing
      alb.ingress.kubernetes.io/target-type: ip
      alb.ingress.kubernetes.io/listen-ports: '[{"HTTPS":443}, {"HTTP":80}]'
      alb.ingress.kubernetes.io/certificate-arn: $CERT_ARN
      alb.ingress.kubernetes.io/success-codes: 200-399
      alb.ingress.kubernetes.io/load-balancer-name: hsh-eks-ingress-alb
      alb.ingress.kubernetes.io/group.name: study
      alb.ingress.kubernetes.io/ssl-redirect: '443'

kube-state-metrics:
  rbac:
    extraRules:
      - apiGroups: ["autoscaling.k8s.io"]
        resources: ["verticalpodautoscalers"]
        verbs: ["list", "watch"]
  customResourceState:
    enabled: true
    config:
      kind: CustomResourceStateMetrics
      spec:
        resources:
          - groupVersionKind:
              group: autoscaling.k8s.io
              kind: "VerticalPodAutoscaler"
              version: "v1"
            labelsFromPath:
              verticalpodautoscaler: [metadata, name]
              namespace: [metadata, namespace]
              target_api_version: [apiVersion]
              target_kind: [spec, targetRef, kind]
              target_name: [spec, targetRef, name]
            metrics:
              - name: "vpa_containerrecommendations_target"
                help: "VPA container recommendations for memory."
                each:
                  type: Gauge
                  gauge:
                    path: [status, recommendation, containerRecommendations]
                    valueFrom: [target, memory]
                    labelsFromPath:
                      container: [containerName]
                commonLabels:
                  resource: "memory"
                  unit: "byte"
              - name: "vpa_containerrecommendations_target"
                help: "VPA container recommendations for cpu."
                each:
                  type: Gauge
                  gauge:
                    path: [status, recommendation, containerRecommendations]
                    valueFrom: [target, cpu]
                    labelsFromPath:
                      container: [containerName]
                commonLabels:
                  resource: "cpu"
                  unit: "core"
  selfMonitor:
    enabled: true

alertmanager:
  enabled: false
defaultRules:
  create: false
kubeControllerManager:
  enabled: false
kubeEtcd:
  enabled: false
kubeScheduler:
  enabled: false
prometheus-windows-exporter:
  prometheus:
    monitor:
      enabled: false
EOT
cat monitor-values.yaml


helm install kube-prometheus-stack prometheus-community/kube-prometheus-stack --version 69.3.1 \
-f monitor-values.yaml --create-namespace --namespace monitoring


# 커스텀 메트릭 확인
kubectl describe clusterrole kube-prometheus-stack-kube-state-metrics | grep verticalpodautoscalers

kubectl describe pod -n monitoring -l app.kubernetes.io/name=kube-state-metrics
kubectl describe cm -n monitoring kube-prometheus-stack-kube-state-metrics-customresourcestate-config

# 프로메테우스 웹 접속
echo -e "https://prometheus.$MyDomain"

# 그라파나 웹 접속 : admin / prom-operator
echo -e "https://grafana.$MyDomain"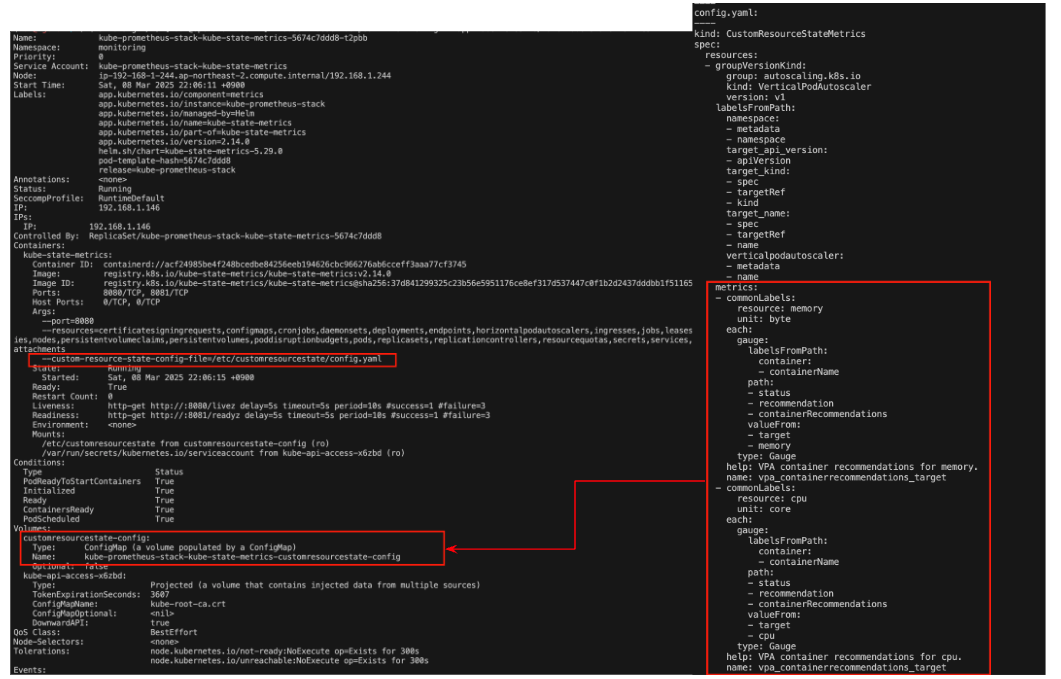
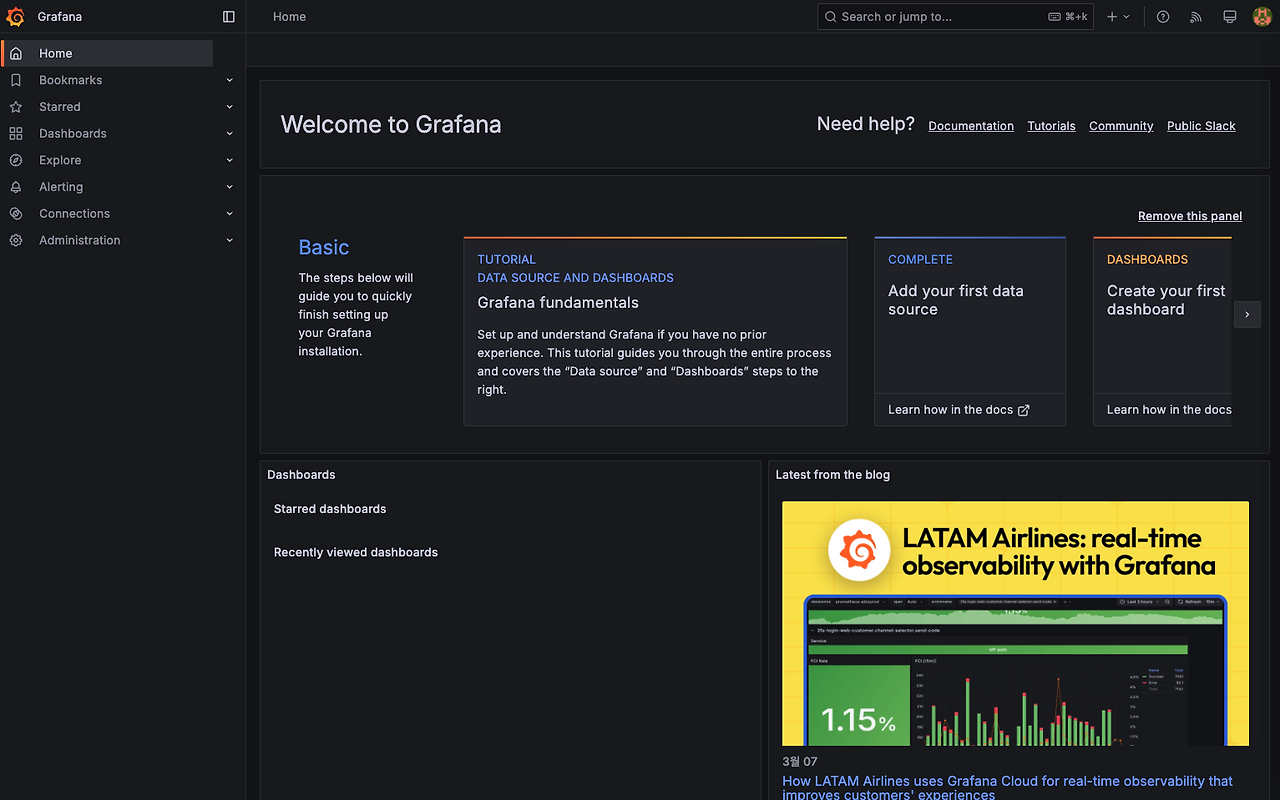
- 기본 대시보드 미구성 설정으로 기본 대시보드는 없음
eks-node-viewer
클러스터 내 노드 사용량 시각화 도구로 요청 request 리소스 표시합니다.
AWS 내부 도구로 개발되었으며, Karpenter를 활용한 노드 통합(consolidation)을 시연을 위한 목적으로 개발한 도구입니다.
# macOS 설치
brew tap aws/tap
brew install eks-node-viewer

# 운영서버 EC2에 설치 : userdata 통해 이미 설치 되어 있음
yum install golang -y
go install github.com/awslabs/eks-node-viewer/cmd/eks-node-viewer@latest  # 설치 시 2~3분 정도 소요


eks-node-viewer --resources cpu,memory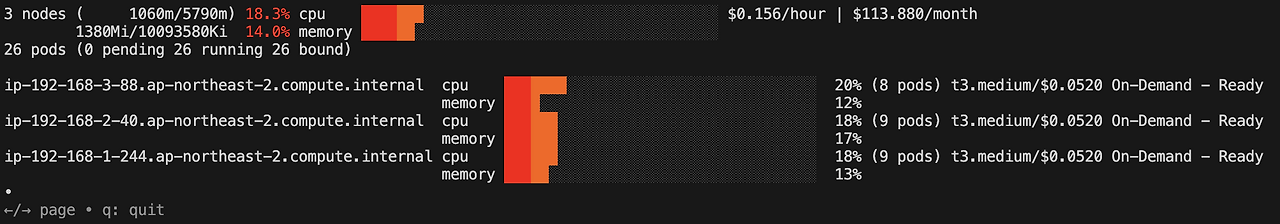
HPA
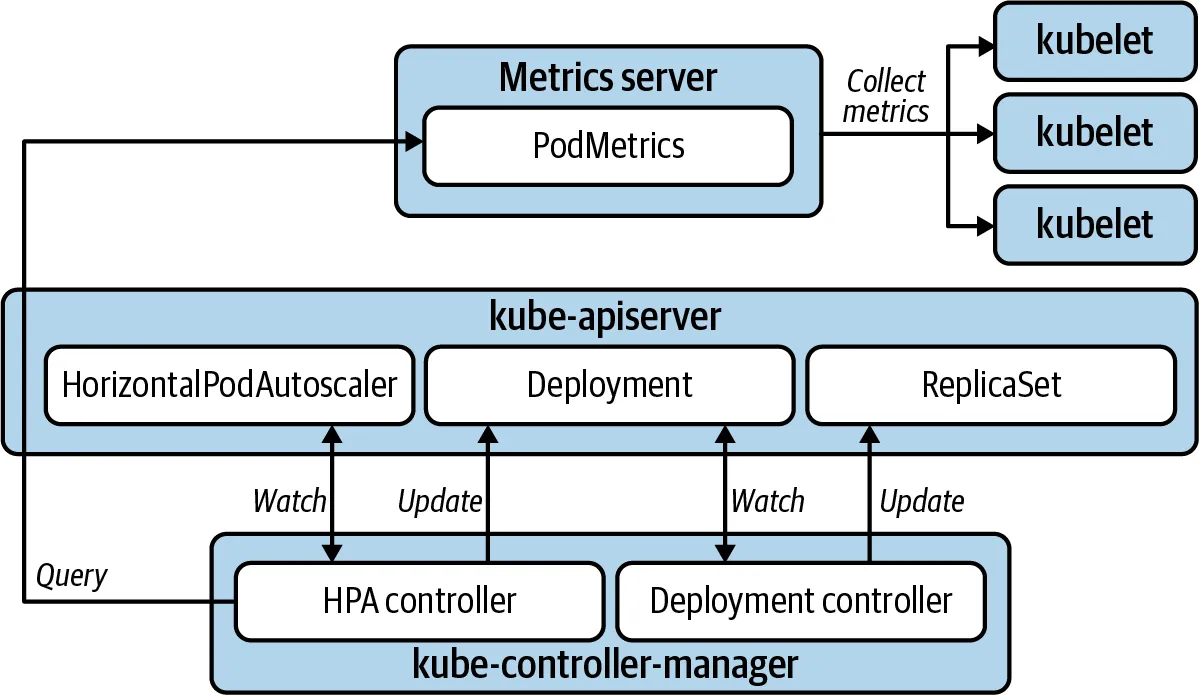
컨테이너의 메모리, CPU 등의 메트릭을 기반으로 자동으로 파드 수를 조정합니다
HPA는 metrics-server 가 수집한 메트릭을 모니터링하고 설정된 HPA 에 따라 파드 수를 조절합니다.
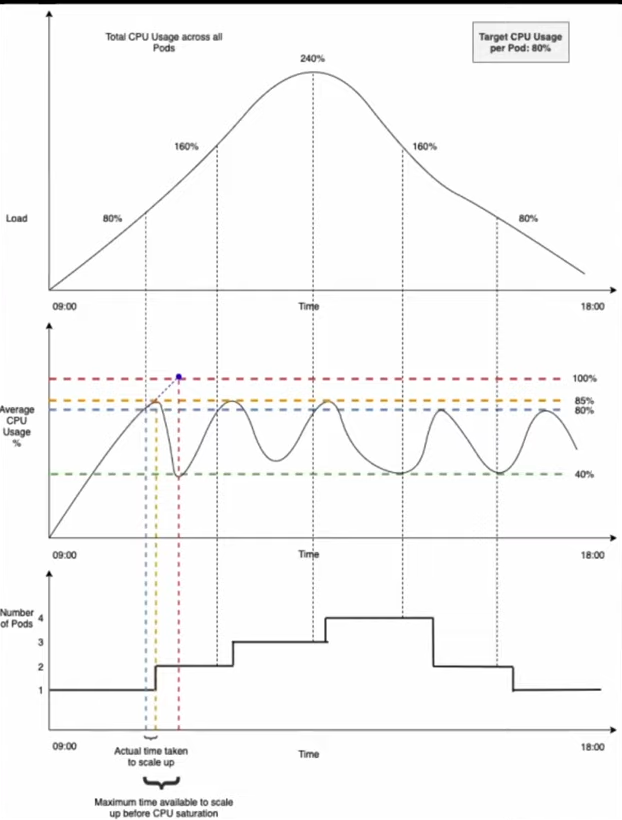
조절 계산식은 다음과 같습니다.
Desired Replicas = (현재 파드 수) * (현재 리소스 사용량 / 목표 리소스 사용량)예를 들어 HPA CPU 사용률을 50%, 파드수가 10개이고, 현재 리소스 사용량이 70% 이라면
10 * (70 / 50) = 14 로 14개 파드로 조절됩니다.
다만, 수집 시간을 주의해야 합니다.
기본 15초 간격으로 CPU 사용량을 수집하고 평균값을 계산하기 때문에 증감이 실제 사용량에 비해 차이가 있을 수 있습니다. 빠르게 반응하려면 목표 리소스량을 안전한 값으로 줄일 수 있어야 합니다.
또한, Spike 트래픽의 경우 Burstable QoS 설정으로 트래픽을 버틸 수 있게 설정해야 합니다.
샘플 애플리케이션 & HPA 설정
cat << EOF > php-apache.yaml
apiVersion: apps/v1
kind: Deployment
metadata:
name: php-apache
spec:
selector:
matchLabels:
run: php-apache
template:
metadata:
labels:
run: php-apache
spec:
containers:
- name: php-apache
image: registry.k8s.io/hpa-example
ports:
- containerPort: 80
resources:
limits:
cpu: 500m
requests:
cpu: 200m
---
apiVersion: v1
kind: Service
metadata:
name: php-apache
labels:
run: php-apache
spec:
ports:
- port: 80
selector:
run: php-apache
EOF
kubectl apply -f php-apache.yaml
cat <<EOF | kubectl apply -f -
apiVersion: autoscaling/v2
kind: HorizontalPodAutoscaler
metadata:
name: php-apache
spec:
scaleTargetRef:
apiVersion: apps/v1
kind: Deployment
name: php-apache
minReplicas: 1
maxReplicas: 10
metrics:
- type: Resource
resource:
name: cpu
target:
averageUtilization: 50
type: Utilization
EOF
# 과부하 주입
kubectl run -i --tty load-generator --rm --image=busybox:1.28 --restart=Never -- /bin/sh -c "while sleep 0.01; do wget -q -O- http://php-apache; done"
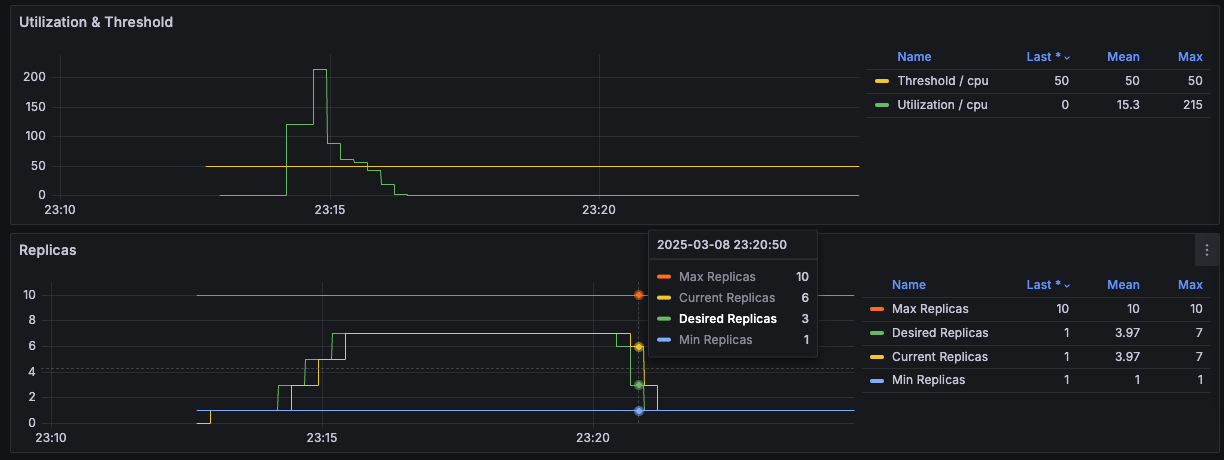
# 이벤트 확인
kubectl describe hpa
..
Events:
Type Reason Age From Message
---- ------ ---- ---- -------
Normal SuccessfulRescale 10m horizontal-pod-autoscaler New size: 3; reason: cpu resource utilization (percentage of request) above target
Normal SuccessfulRescale 9m34s horizontal-pod-autoscaler New size: 5; reason: cpu resource utilization (percentage of request) above target
Normal SuccessfulRescale 9m4s horizontal-pod-autoscaler New size: 7; reason: cpu resource utilization (percentage of request) above target
Normal SuccessfulRescale 3m49s horizontal-pod-autoscaler New size: 6; reason: All metrics below target
Normal SuccessfulRescale 3m34s horizontal-pod-autoscaler New size: 3; reason: All metrics below target
Normal SuccessfulRescale 3m19s horizontal-pod-autoscaler New size: 1; reason: All metrics below target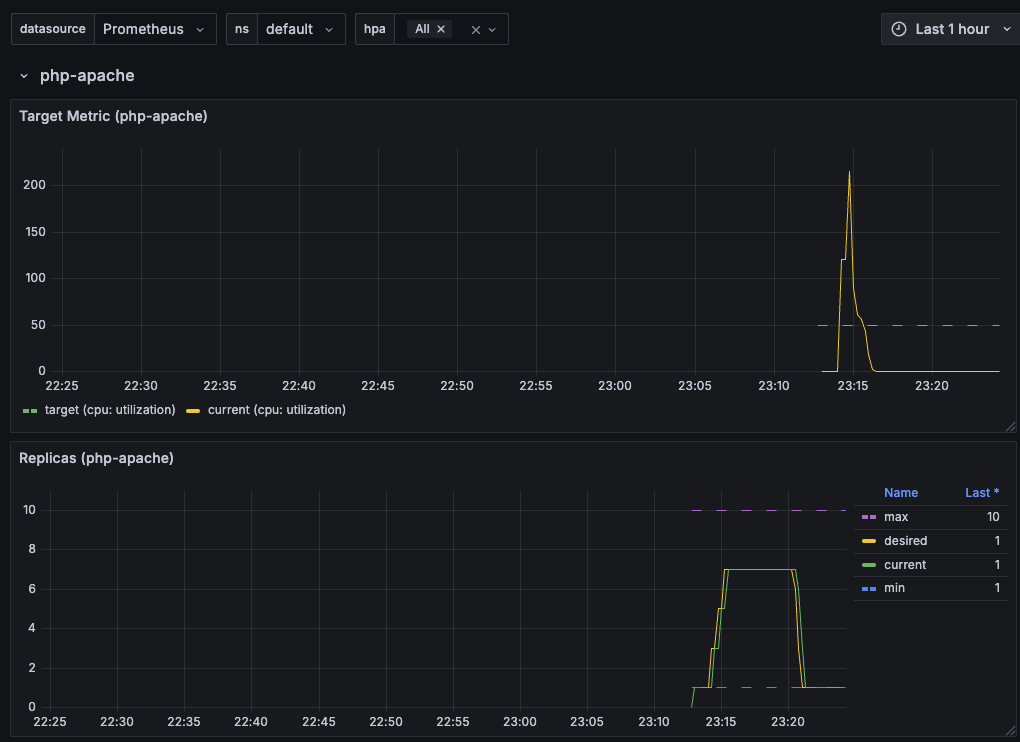
스케일 동작 또한 설정이 가능하다. 기본적으로 스케일링 설정은 다음과 같습니다.
behavior:
  scaleDown:
    stabilizationWindowSeconds: 300
    policies:
    - type: Percent
      value: 100
      periodSeconds: 15
  scaleUp:
    stabilizationWindowSeconds: 0
    policies:
    - type: Percent
      value: 100
      periodSeconds: 15
    - type: Pods
      value: 4
      periodSeconds: 15
selectPolicy: Max- 스케일 다운: 5분 동안 안정화 후, 현재 실행 중인 파드의 100%까지 15초마다 축소할 수 있습니다.
- 스케일 업: 확장 시 즉시 적용되며, 15초마다 최대 100% 또는 최대 4개 파드를 추가합니다. 확장 시 두 가지 정책 중 더 큰 값을 적용합니다.
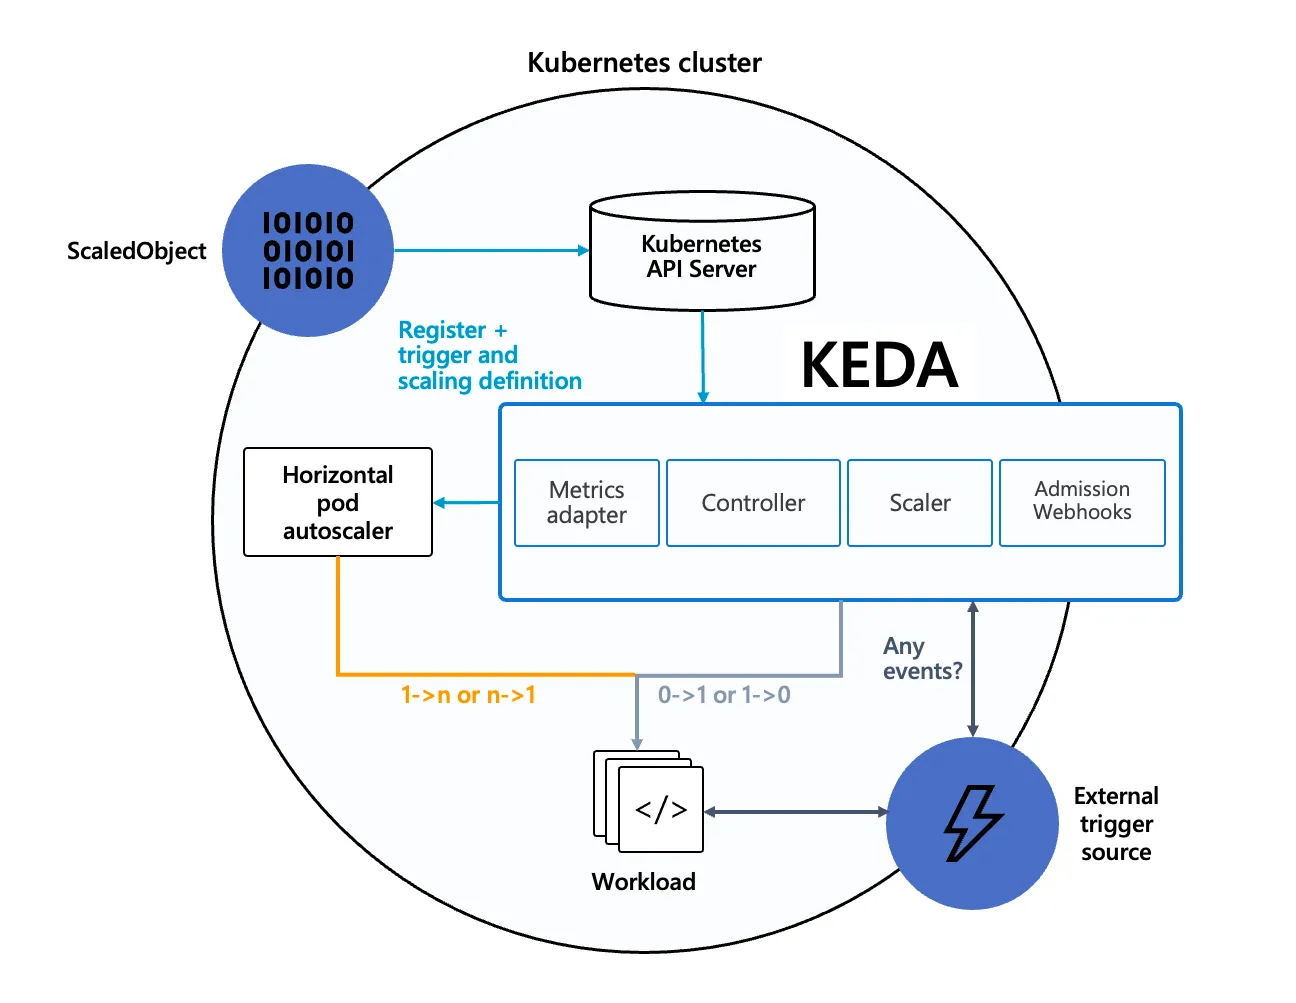
KEDA
KEDA(Kubernetes Event-Driven Autoscaling)는 특정 이벤트를 기반으로 파드 스케일 여부를 결정할 수 있는 도구입니다. 특정 이벤트란 다른 시스템(카프카, DB, cron 등으로) 등의 이벤트입니다.
각 이벤트에 대한 지원 및 설정 방법은 공식 문서를 참고해주세요.
- Agent (keda-operator)
- Metrics Server (keda-operator-metrics-apiserver)
- Admission Webhooks (keda-admission-webhooks)
# 설치
cat < keda-values.yaml
metricsServer:
  useHostNetwork: true

prometheus:
  metricServer:
    enabled: true
    port: 9022
    portName: metrics
    path: /metrics
    serviceMonitor:
      # Enables ServiceMonitor creation for the Prometheus Operator
      enabled: true
    podMonitor:
      # Enables PodMonitor creation for the Prometheus Operator
      enabled: true
  operator:
    enabled: true
    port: 8080
    serviceMonitor:
      # Enables ServiceMonitor creation for the Prometheus Operator
      enabled: true
    podMonitor:
      # Enables PodMonitor creation for the Prometheus Operator
      enabled: true
  webhooks:
    enabled: true
    port: 8020
    serviceMonitor:
      # Enables ServiceMonitor creation for the Prometheus webhooks
      enabled: true
EOT

helm repo add kedacore https://kedacore.github.io/charts
helm repo update
helm install keda kedacore/keda --version 2.16.0 --namespace keda --create-namespace -f keda-values.yaml


# KEDA는 외부 이벤트 소스(Kafka, RabbitMQ, SQS 등)에서 발생하는 메트릭을 수집하고,
# 이를 Kubernetes HPA가 활용할 수 있도록 제공
kubectl get pod -n keda -l app=keda-operator-metrics-apiserver
kubectl get --raw "/apis/external.metrics.k8s.io/v1beta1" | jq
{
  "kind": "APIResourceList",
  "apiVersion": "v1",
  "groupVersion": "external.metrics.k8s.io/v1beta1",
  "resources": [
    {
      "name": "externalmetrics",
      "singularName": "",
      "namespaced": true,
      "kind": "ExternalMetricValueList",
      "verbs": [
        "get"
      ]
    }
  ]
}

# 예제 애플리케이션 배포
kubectl apply -f php-apache.yaml -n keda
kubectl get pod -n keda

# KEDA ScaledObject 정책 생성
cat < keda-cron.yaml
apiVersion: keda.sh/v1alpha1
kind: ScaledObject
metadata:
  name: php-apache-cron-scaled
spec:
  minReplicaCount: 0
  maxReplicaCount: 2  # Specifies the maximum number of replicas to scale up to (defaults to 100).
  pollingInterval: 30  # Specifies how often KEDA should check for scaling events
  cooldownPeriod: 300  # Specifies the cool-down period in seconds after a scaling event
  scaleTargetRef:  # Identifies the Kubernetes deployment or other resource that should be scaled.
    apiVersion: apps/v1
    kind: Deployment
    name: php-apache
  triggers:  # Defines the specific configuration for your chosen scaler, including any required parameters or settings
  - type: cron
    metadata:
      timezone: Asia/Seoul
      start: 00,15,30,45 * * * *
      end: 05,20,35,50 * * * *
      desiredReplicas: "1"
EOT

kubectl apply -f keda-cron.yaml -n keda

kubectl get hpa -o jsonpath="{.items[0].spec}" -n keda | jq
{
  "maxReplicas": 2,
  "metrics": [
    {
      "external": {
        "metric": {
          "name": "s0-cron-Asia-Seoul-00,15,30,45xxxx-05,20,35,50xxxx",
          "selector": {
            "matchLabels": {
              "scaledobject.keda.sh/name": "php-apache-cron-scaled"
            }
          }
        },
        "target": {
          "averageValue": "1",
          "type": "AverageValue"
        }
      },
      "type": "External"
    }
  ],
  "minReplicas": 1,
  "scaleTargetRef": {
    "apiVersion": "apps/v1",
    "kind": "Deployment",
    "name": "php-apache"
  }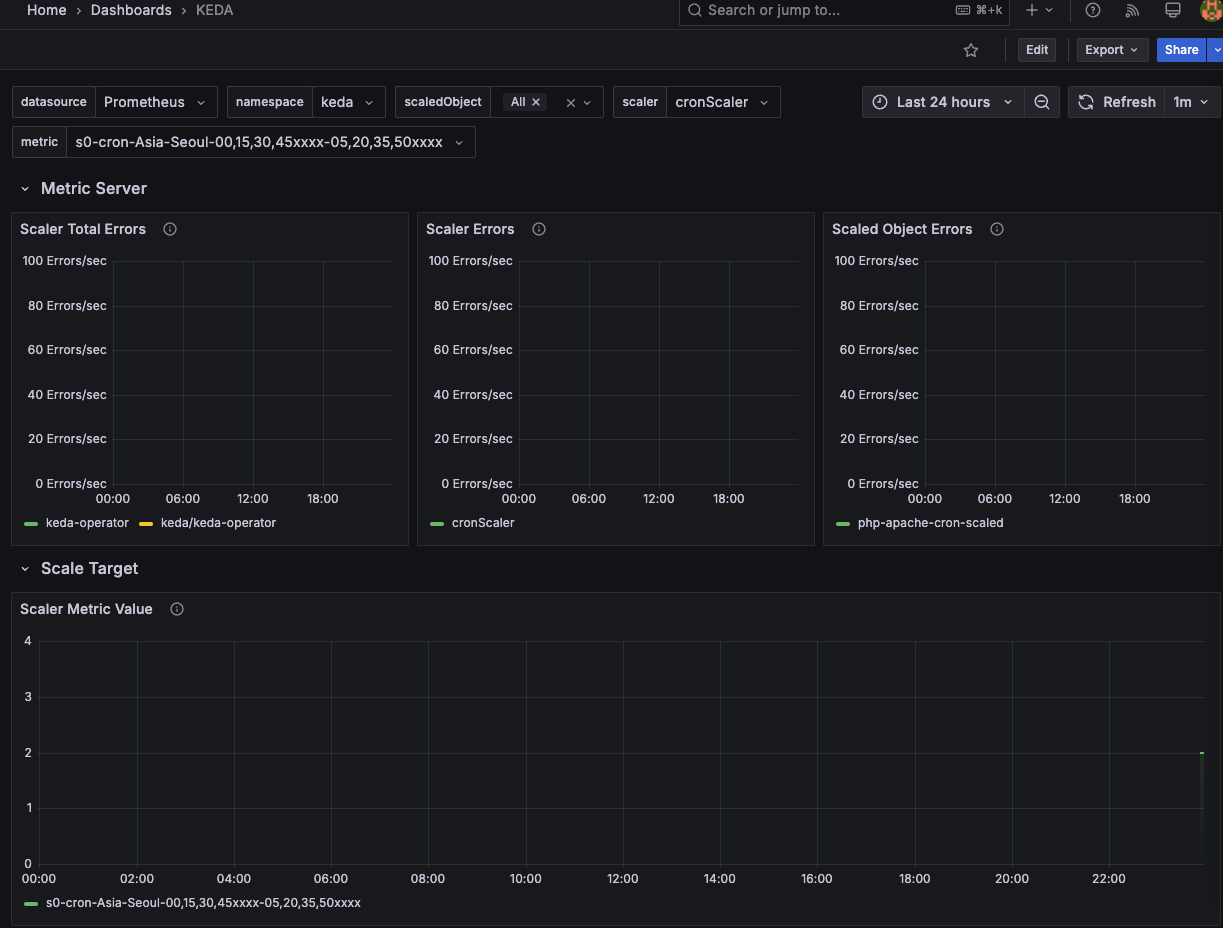
}- KEDA 그라파나 대시보드 또한 참고 가능
VPA 과 파드 리소스 최적 설정
VPA는 Pod Resource Request를 최적값으로 수정해주는 도구입니다.
VPA Recommender를 통해 다음의 계산식으로 최적의 Request을 찾습니다.
추천값=기준값×(1+마진)- 기준값은 과거 사용량 데이터를 기반으로 target-percentile 분위수 값을 기준값으로 설정합니다.
- margin이라는 버퍼를 두어 범위를 두어 곱함(기본값 0.15)
최적 값을 구하고 VPA updater가 기존 파드를 Evict하고 새로운 파드의 request 값을 반영하여 생성합니다.
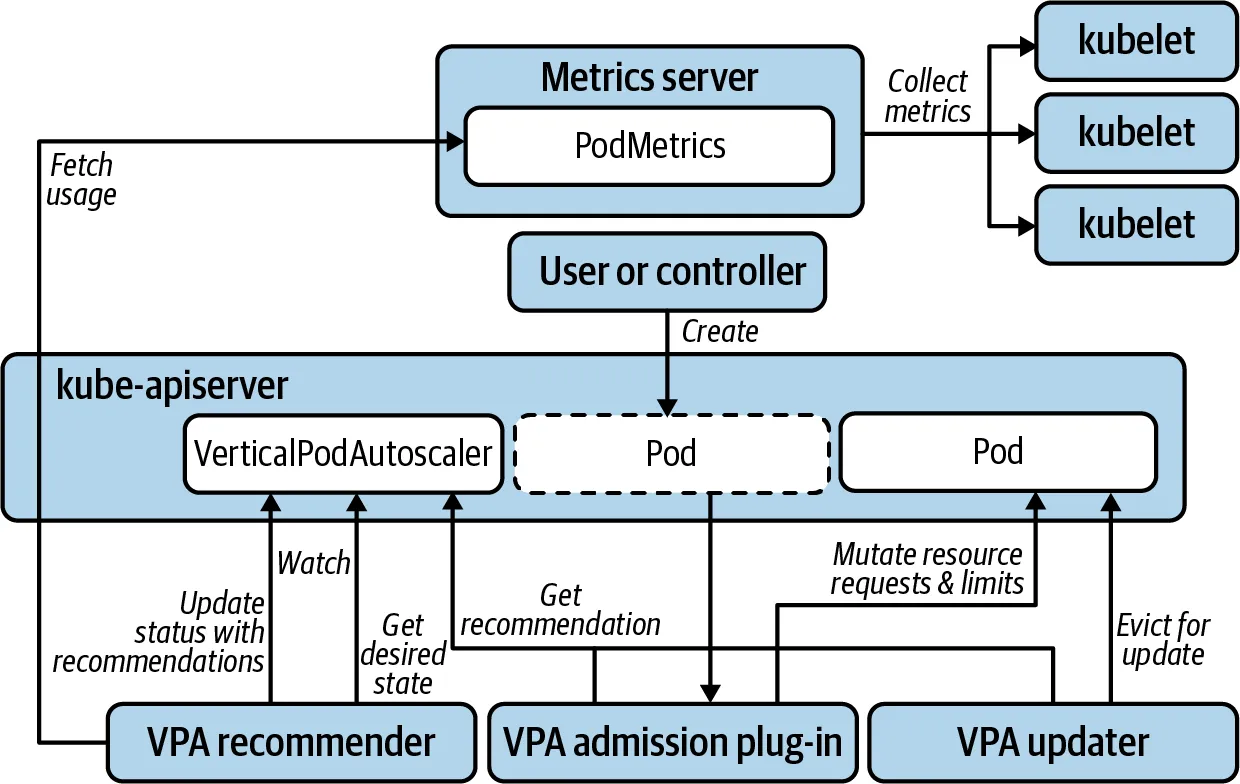
다만, 파드를 재생성하기에 서비스 안정성이 많이 떨어질 수 있습니다.
또한, HPA와 같이 동작할 수 없기에 실무에서 사용하는 사례는 본 적이 없었습니다.
VPA의 목적인 최적의 pod request 값을 찾아 자원 최적화를 하는 것도 방법이 될 수 있습니다.
Jerry님 블로그 블로그 글을 참고하여 정리하자면 파드 자원에 대한 최적화 사례를 확인할 수 있습니다.
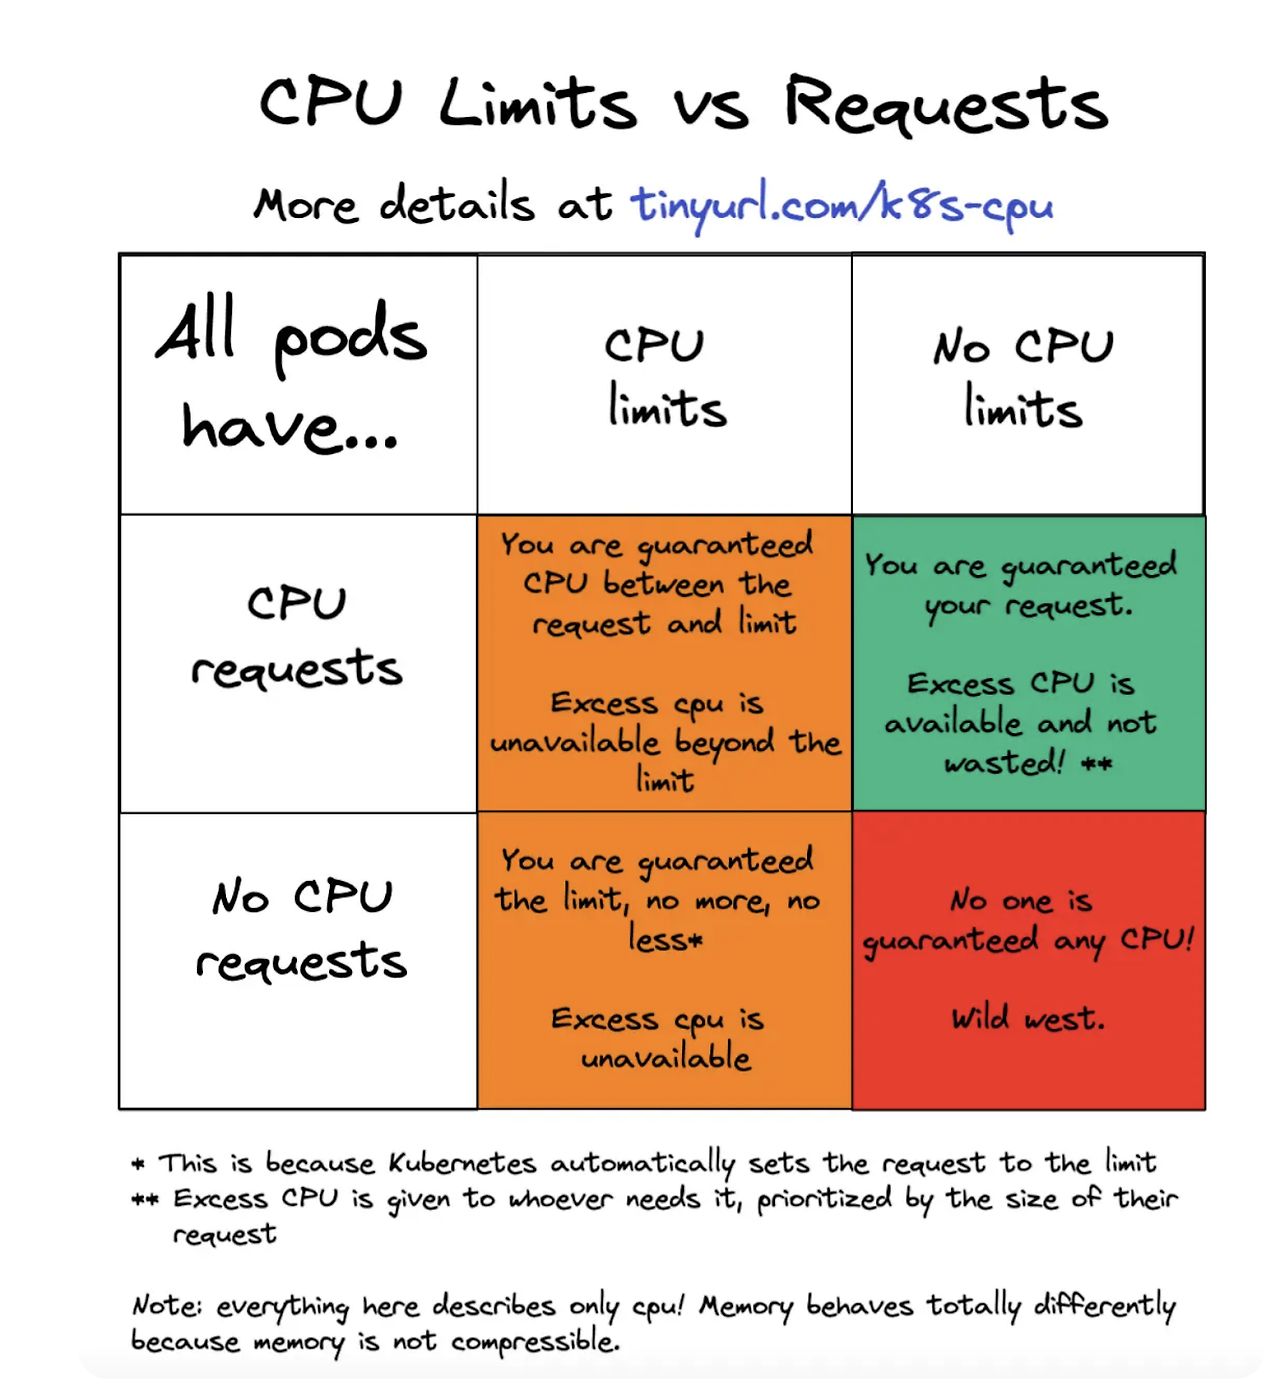
- CPU는 압축 가능한 자원으로 파드 추출 조건이 아님
- CPU Limit 을 해제하면 가용 CPU 범위에서 자유롭게 사용할 수 있어 성능 향상에 도움이 될 수 있음
- 자바 애플리케이션 같이 초기 기동 CPU 자원 사용량이 많은 경우 Readiness, Liveness Probe 실패하는 문제를 해결 할 수 있음
- 추가로 podantiaffinity 설정을 하면 특정 노드에 파드가 동시에 실행하여 해당 노드의 CPU를 과도하게 사용하는 문제를 방지할 수 있음
파드 리소스 사용량에 대한 추천으로는 KRR 툴로 참고가 될 수 있습니다.
KRR(Prometheus-based Kubernetes Resource Recommendations)은 실제 사용량을 기준으로 Request와 Limit 사용량을 추천합니다.
프로메테우스에 수집된 데이터를 기반으로 CLI를 통해 자유롭게 커스터마이징할 수 있습니다.
# mac 내 krr 설치
brew tap robusta-dev/homebrew-krr
brew install krr
krr --help

# 인증 정보 설정
aws eks --region ap-northeast-2 update-kubeconfig --name hsh-eks

# 기본 설정
## CPU: 요청값을 95번째 백분위수로 설정하여, 95%의 경우에 요청이 충분하게 됩니다. 제한(limit)을 설정하지 않아, 다른 파드가 사용하지 않는 CPU를 자유롭게 사용할 수 있습니다.
## 메모리: 지난 1주일 동안의 최대 값을 기반으로 요청값을 설정하고, 여기에 15% 버퍼를 추가하여 설정합니다.
krr simple

# 커스터 마이징
## 720 시간 동안의 자원 사용량을 기반으로 추천하고 CPU 사용량 중 90%를 기반으로 요청 값을 추천하며 메모리 요청 값에 10%더한 값을 추천
krr simple --history_duration 720 --cpu_percentile 90 --memory_buffer_percentage 10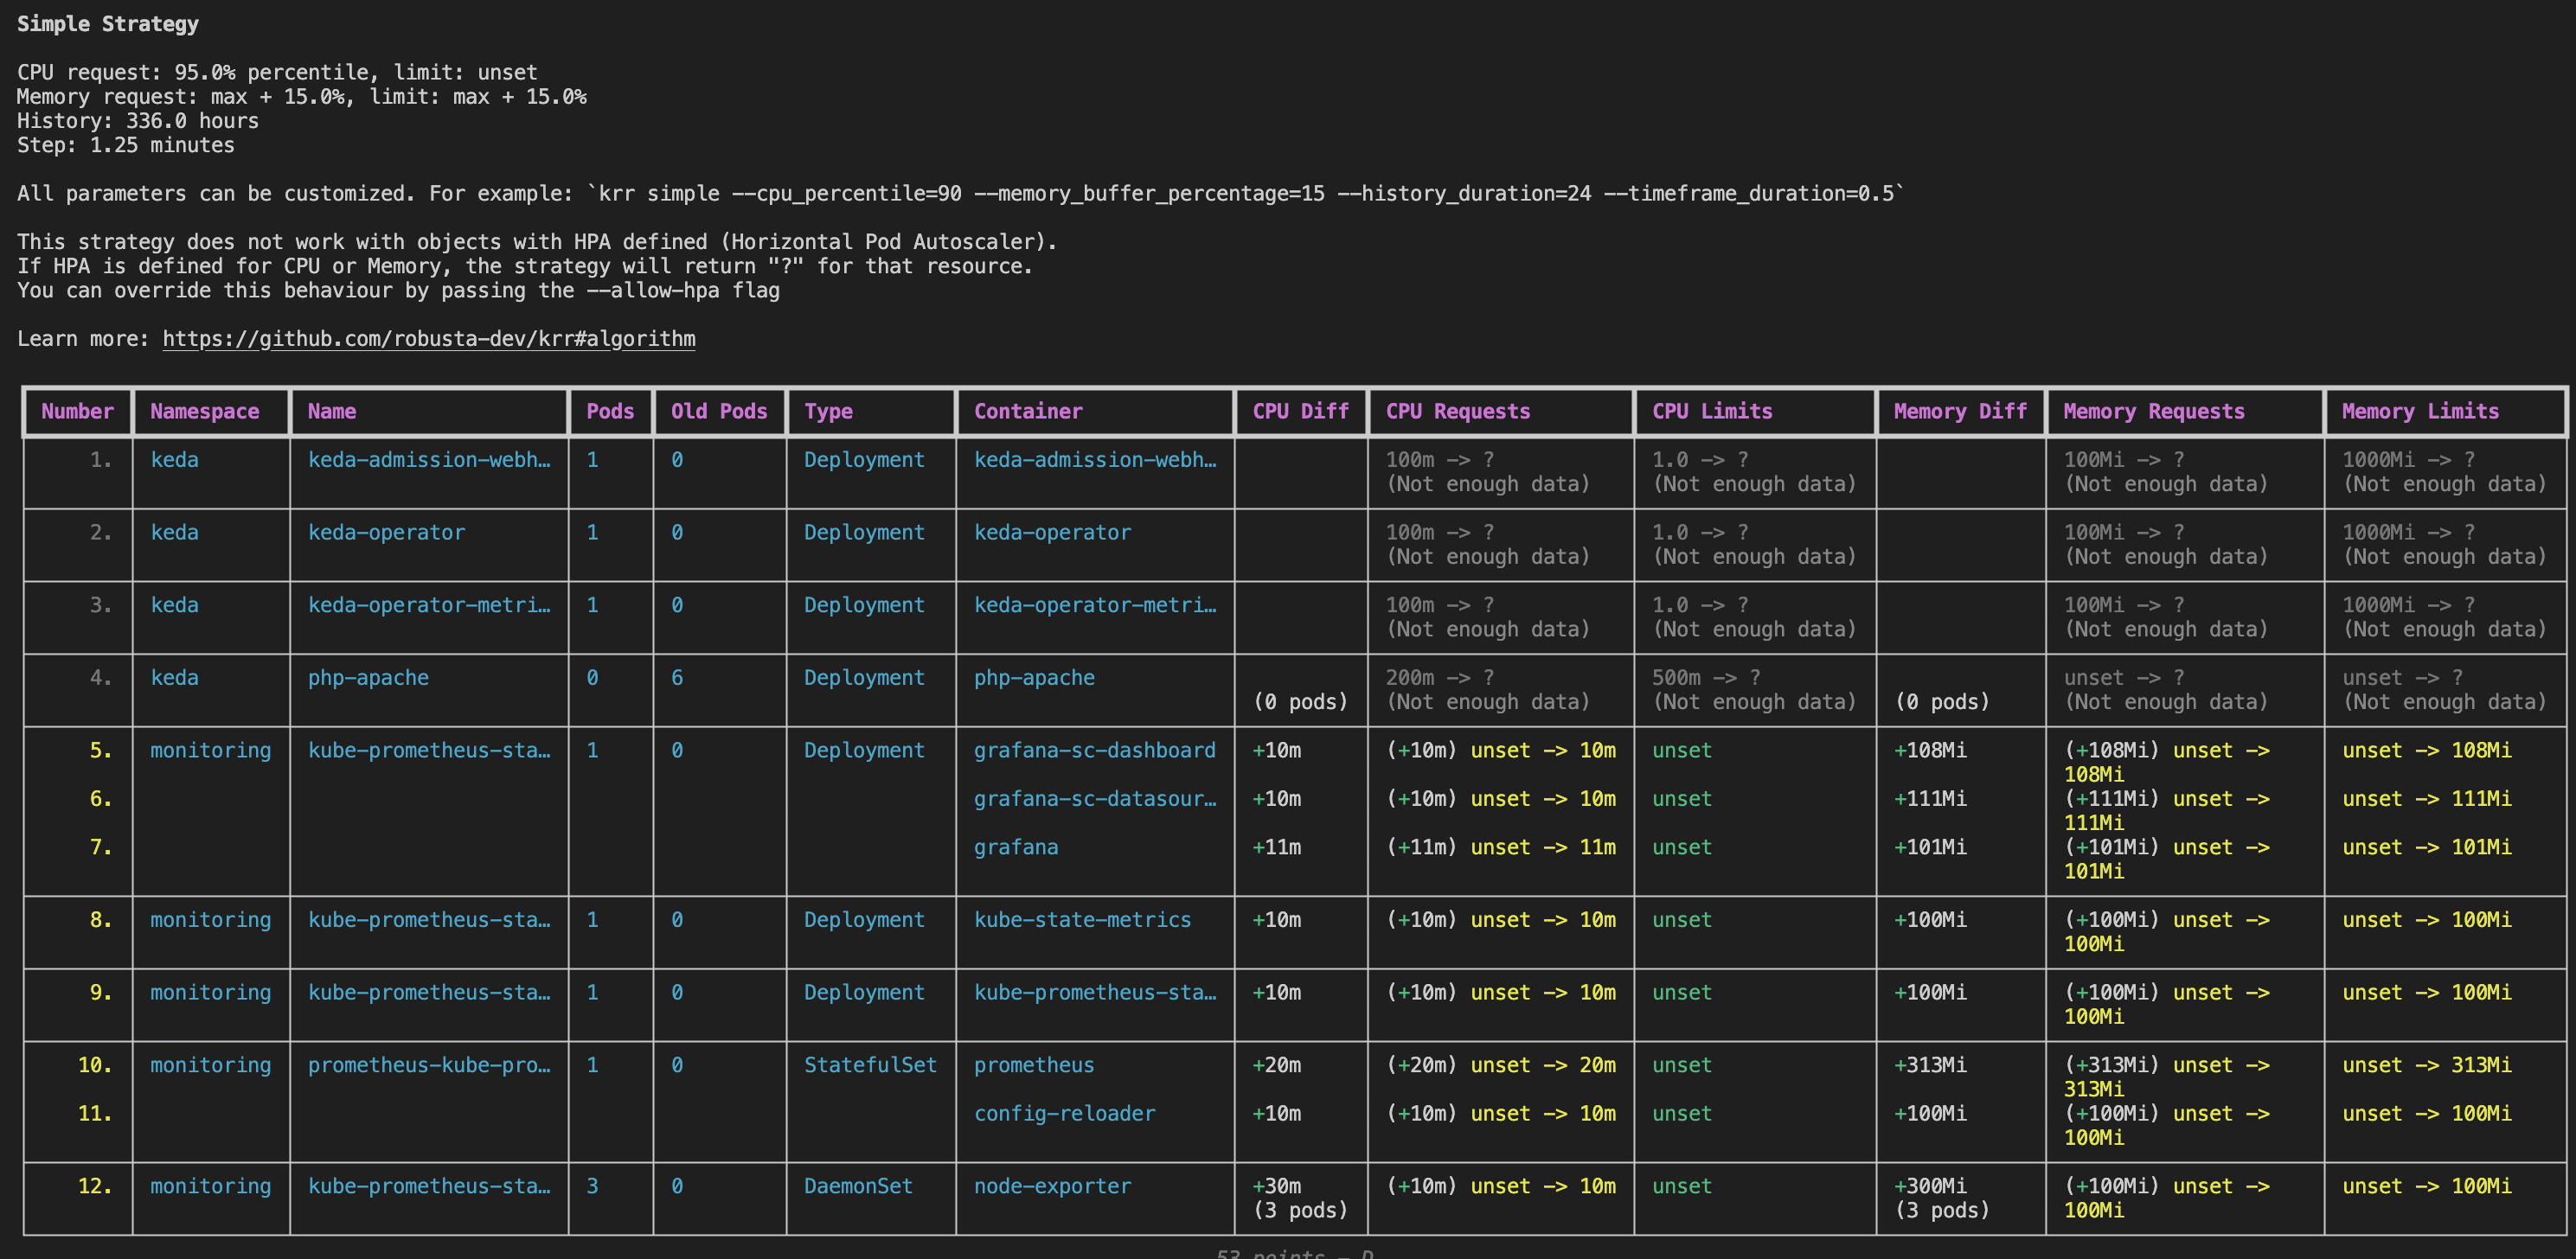
Cluster Autoscaler(CAS)
Cluster Autoscaler는 Kubernetes 클러스터의 크기를 자동으로 조정하는 도구입니다.
pending 상태인 파드가 존재할 경우, 워커 노드를 스케일 아웃하며 특정 시간을 간격으로 사용률을 확인하여 스케일 인/아웃을 수행합니다. AWS에서는 ASG를 사용하여 적용합니다.
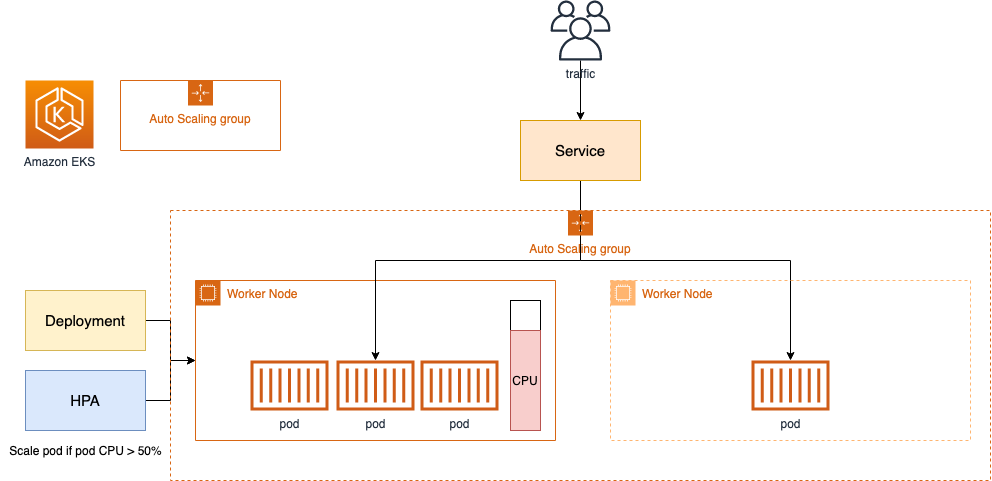
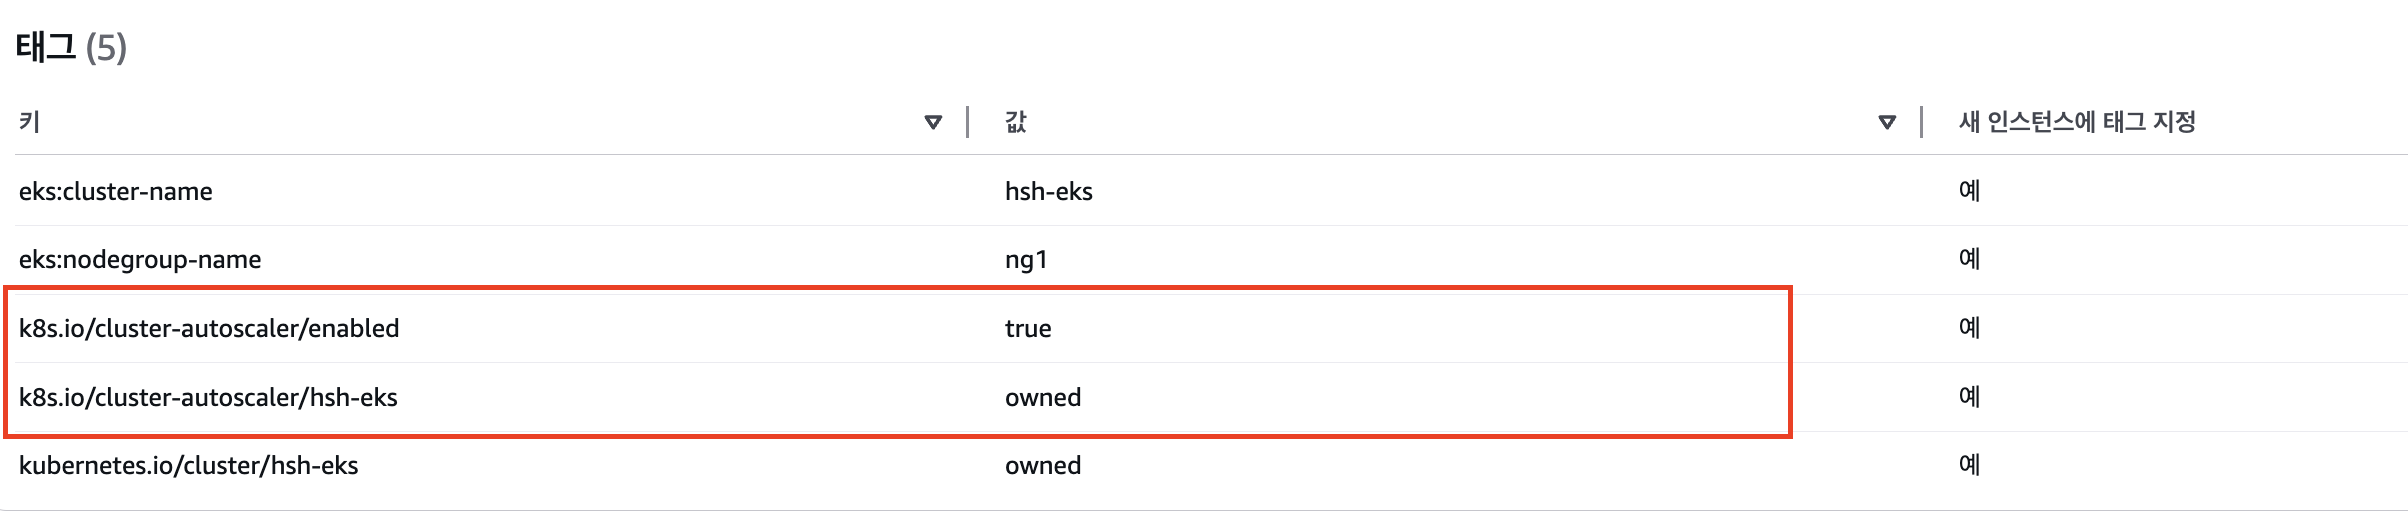
동작 방식으로는 Cluster autoscaler 파드를 배포하여 Auto Scaling 그룹의 상태를 모니터링하면서, 노드가 부족하거나 과다한 상태에 따라 노드 수를 조정합니다.
- Auto Scaling 그룹을 모니터링하기 위해서는 ASG에 특정 태그가 할당되어야 합니다
# 아래 옵션 클러스터 이름 기입
curl -s -O https://raw.githubusercontent.com/kubernetes/autoscaler/master/cluster-autoscaler/cloudprovider/aws/examples/cluster-autoscaler-autodiscover.yaml
...
- ./cluster-autoscaler
- --v=4
- --stderrthreshold=info
- --cloud-provider=aws
- --skip-nodes-with-local-storage=false # 로컬 스토리지를 가진 노드를 autoscaler가 scale down할지 결정, false(가능!)
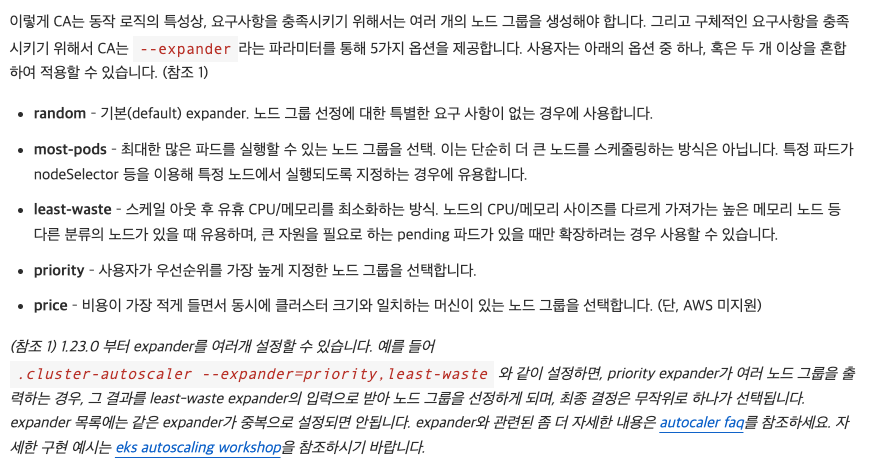
- --expander=least-waste # 노드를 확장할 때 어떤 노드 그룹을 선택할지를 결정, least-waste는 리소스 낭비를 최소화하는 방식으로 새로운 노드를 선택.
- --node-group-auto-discovery=asg:tag=k8s.io/cluster-autoscaler/enabled,k8s.io/cluster-autoscaler/
...
sed -i -e "s||$CLUSTER_NAME|g" cluster-autoscaler-autodiscover.yaml
kubectl apply -f cluster-autoscaler-autodiscover.yaml
# (옵션) cluster-autoscaler 파드가 동작하는 워커 노드가 퇴출(evict) 되지 않게 설정
kubectl -n kube-system annotate deployment.apps/cluster-autoscaler cluster-autoscaler.kubernetes.io/safe-to-evict="false"
- --skip-nodes-with-local-storage=false : 로컬 스토리지를 가진 노드를 autoscaler가 scale down할지 결정, false(가능!)
- --expander : CA 동작 로직
예제 애플리케이션 배포하기 전 ASG 최소, 최대 값을 설정해야 합니다.
aws autoscaling describe-auto-scaling-groups \
    --query "AutoScalingGroups[? Tags[? (Key=='eks:cluster-name') && Value=='hsh-eks']].[AutoScalingGroupName, MinSize, MaxSize,DesiredCapacity]" \
    --output table
-----------------------------------------------------------------
|                   DescribeAutoScalingGroups                   |
+------------------------------------------------+----+----+----+
|  eks-ng1-08caba8a-0397-e793-11f7-8fe17175129d  |  3 |  4 |  4 |
+------------------------------------------------+----+----+----+


cat << EOF > nginx.yaml
apiVersion: apps/v1
kind: Deployment
metadata:
  name: nginx-to-scaleout
spec:
  replicas: 1
  selector:
    matchLabels:
      app: nginx
  template:
    metadata:
      labels:
        service: nginx
        app: nginx
    spec:
      containers:
      - image: nginx
        name: nginx-to-scaleout
        resources:
          limits:
            cpu: 500m
            memory: 512Mi
          requests:
            cpu: 500m
            memory: 512Mi
EOF
kubectl apply -f nginx.yaml

# 파드 개수 증가
kubectl scale --replicas=15 deployment/nginx-to-scaleout && date


# CAS 로그 동작 확인
kubectl -n kube-system logs -f deployment/cluster-autoscaler

# [운영서버 EC2] 최근 1시간 Fleet API 호출 확인 - Link
# https://ap-northeast-2.console.aws.amazon.com/cloudtrailv2/home?region=ap-northeast-2#/events?EventName=CreateFleet
aws cloudtrail lookup-events \
  --lookup-attributes AttributeKey=EventName,AttributeValue=CreateFleet \
  --start-time "$(date -d '1 hour ago' --utc +%Y-%m-%dT%H:%M:%SZ)" \
  --end-time "$(date --utc +%Y-%m-%dT%H:%M:%SZ)"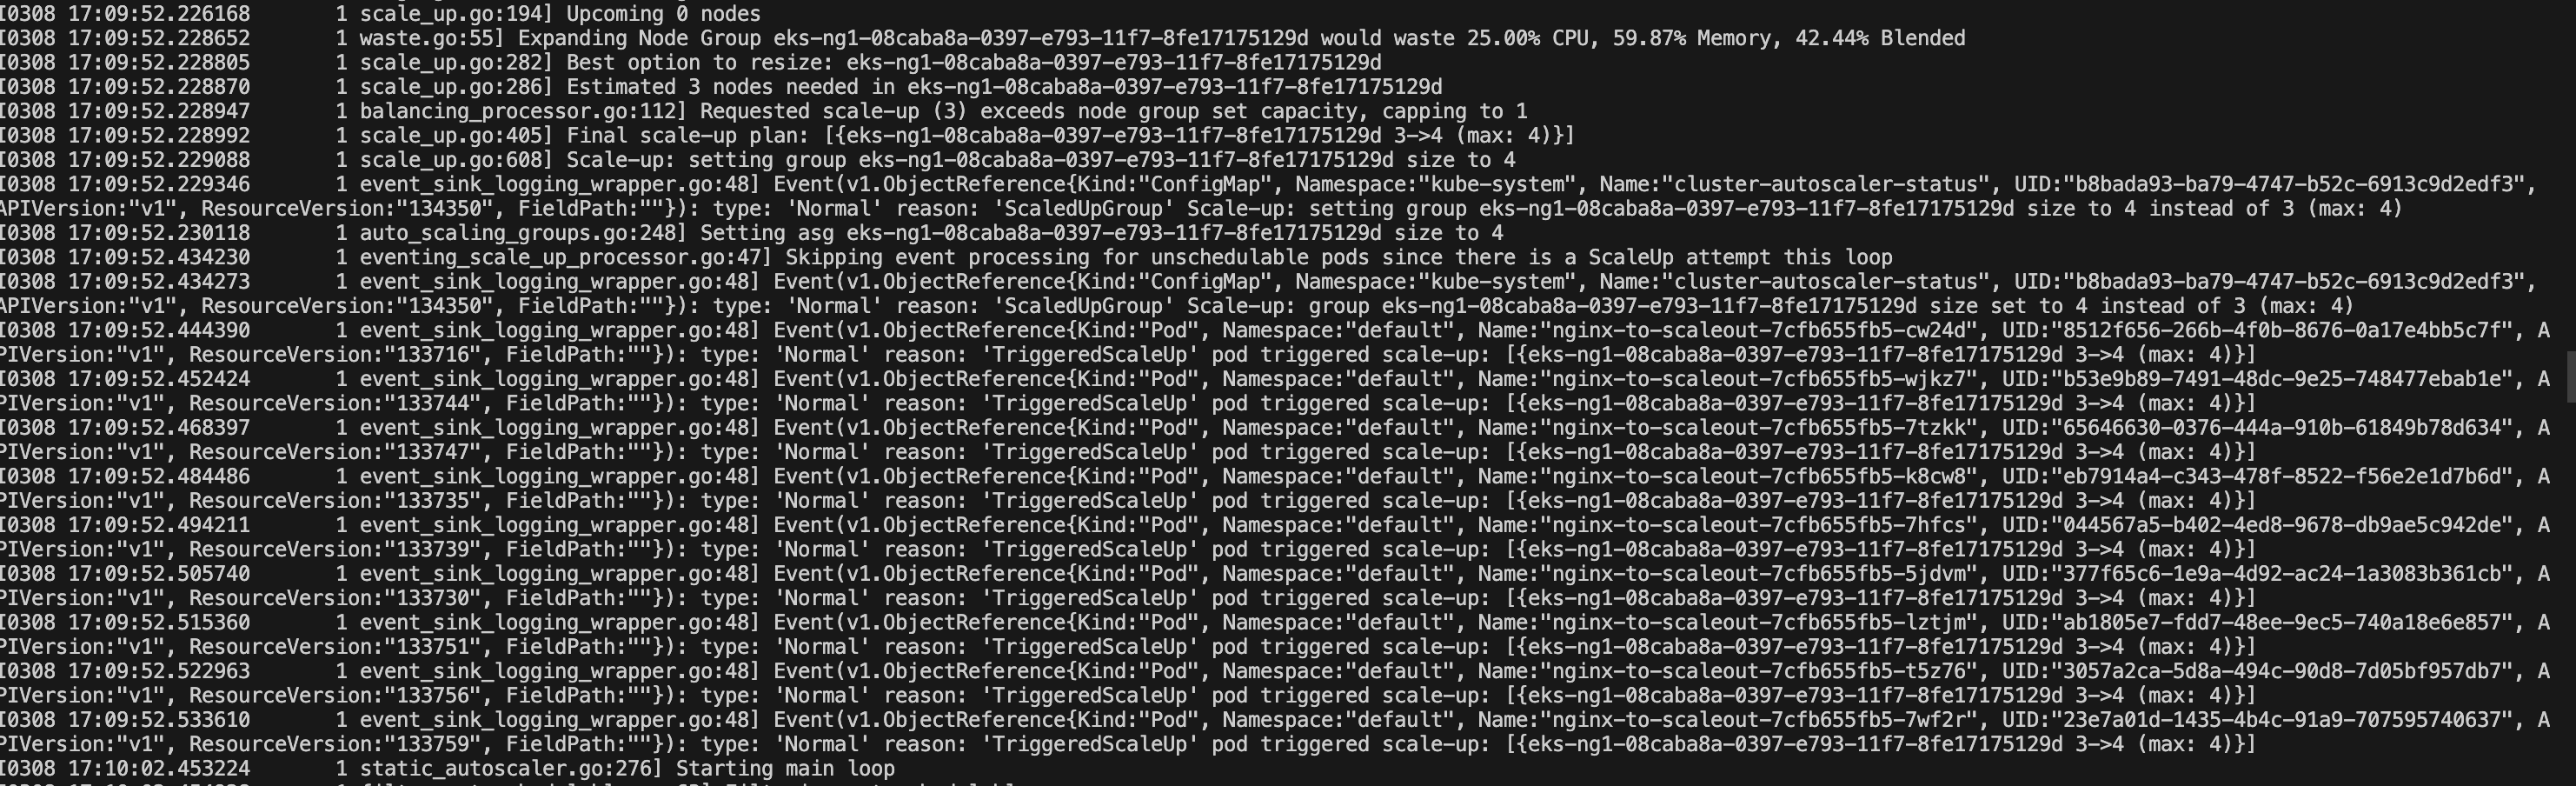
노드에 대한 축소는 기본 10분 후 scale down됩니다.
축소에 대한 동작은 Cluster Ausotscaler 옵션을 수정하여 조절할 수 있습니다.
# [scale-down] 노드 갯수 축소 : 기본은 10분 후 scale down 됨, 물론 아래 flag 로 시간 수정 가능 >> 그러니 디플로이먼트 삭제 후 10분 기다리고 나서 보자!
# By default, cluster autoscaler will wait 10 minutes between scale down operations,
# you can adjust this using the --scale-down-delay-after-add, --scale-down-delay-after-delete,
# and --scale-down-delay-after-failure flag.
# E.g. --scale-down-delay-after-add=5m to decrease the scale down delay to 5 minutes after a node has been added.
kubectl edit deploy cluster-autoscaler -n kube-system
..
   rollingUpdate:
      maxSurge: 25%
      maxUnavailable: 25%
    type: RollingUpdate
  template:
    metadata:
      annotations:
        prometheus.io/port: "8085"
        prometheus.io/scrape: "true"
      creationTimestamp: null
      labels:
        app: cluster-autoscaler
    spec:
      containers:
      - command:
        - ./cluster-autoscaler
        - --v=4
        - --stderrthreshold=info
        - --cloud-provider=aws
        - --skip-nodes-with-local-storage=false
        - --expander=least-waste
        - --node-group-auto-discovery=asg:tag=k8s.io/cluster-autoscaler/enabled,k8s.io/cluster-autoscaler/hsh-eks
        - --scale-down-delay-after-add=5m
        - --scale-down-delay-after-delete=5m
        - --scale-down-delay-after-failure=5m
        image: registry.k8s.io/autoscaling/cluster-autoscaler:v1.26.2
        imagePullPolicy: Always
...- -scale-down-delay-after-add=5m: 노드 추가 후 5분 동안 스케일 다운 대기
- -scale-down-delay-after-delete=5m: 노드 삭제 후 5분 동안 스케일 다운 대기
- -scale-down-delay-after-failure=5m: 실패 후 5분 동안 스케일 다운 대기
자원 삭제
nohup sh -c "eksctl delete cluster --name $CLUSTER_NAME && aws cloudformation delete-stack --stack-name $CLUSTER_NAME" > /root/delete.log 2>&1 &'Cloud' 카테고리의 다른 글
| EKS Security (2) | 2025.03.16 |
|---|---|
| EKS Karpenter (0) | 2025.03.09 |
| Grafana Observability구성 (0) | 2025.03.01 |
| EKS 노드 그룹 (1) | 2025.02.23 |
| EBS CSI Controller 정리 (1) | 2025.02.23 |