LLM 서빙을 위한 실습 환경 구성으로 EKS 위에서 vLLM 을 서빙하는 예제를 실습하겠습니다.
본 내용은 RayServe와 vLLM을 사용한 LLM 배포참고하였습니다.
AI on EKS 기반 서빙 시스템 구축
Ray Serve와 vLLM 백엔드를 사용하여 대규모 언어 모델(LLM)을 배포하는 방법을 살펴봅니다. mistralai/Mistral-7B-Instruct-v0.2 모델을 사용하여 패턴을 시연합니다.
환경 구성
Terraform IaC(Infrastructure as Code) 템플릿을 사용하여 Amazon EKS 클러스터를 배포하고, RayServe YAML 구성을 사용하여 모델을 배포할 때 Karpenter를 사용하여 GPU 노드를 동적으로 스케일링합니다.
참고 사항
- g5.8xlarge 인스턴스 구성으로 비용 소요가 큽니다. (한국 리전 기준. On-demand $3.010, Spot $0.867)
- 배포 환경 기준 Quota 확장이 반드시 필요합니다. All G and VT Spot Instance Requests (스팟) 을 32까지 확장해야 합니다.
# AWS 프로필 설정
cat ~/.aws/credentials
export AWS_PROFILE=".." # 프로필 설정

git clone https://github.com/awslabs/ai-on-eks.git
cd ai-on-eks/infra/jark-stack/
JARK Stack이란? (Claude)각 구성 요소의 역할:
- JupyterHub — 노트북 기반 모델 개발/실험을 위한 협업 환경
- Argo Workflows — 데이터 준비부터 모델 배포까지 파이프라인 자동화
- Ray (KubeRay) — 분산 학습/추론을 위한 스케일아웃 프레임워크
- Kubernetes (EKS) — 이 모든 걸 오케스트레이션하는 기반
여기에 ArgoCD, Argo Events, AI/ML 관측성 스택(Prometheus/Grafana/OpenSearch/OpenCost 등), NVIDIA GPU 지원(Device Plugin, 선택적으로 DRA Driver/GPU Operator)까지 함께 배포됩니다.
infra/jark-stack/
├── install.sh              # base terraform 모듈을 _LOCAL로 복사 후 설치 실행하는 래퍼 스크립트
├── terraform/
│   └── blueprint.tfvars    # 이 블루프린트 전용 설정값 (활성화할 애드온 목록 등)
├── src/                    # 데모 애플리케이션 (Stable Diffusion 기반 "dogbooth" 예제)
│   ├── app/                # Streamlit 프런트엔드 (streamlit.py, Dockerfile, streamlit.yaml)
│   ├── notebook/            # JupyterHub용 데모 노트북 (dogbooth.ipynb) + Dockerfile
│   └── service/             # Ray Serve로 배포하는 추론 서비스 (dogbooth.py, ray-service.yaml)
└── examples/k8s-dra/       # NVIDIA Dynamic Resource Allocation(DRA) 예제 매니페스트
    ├── basic/               # 기본 GPU 클레임
    ├── mps/                 # Multi-Process Service 방식 GPU 공유
    ├── mig/                 # Multi-Instance GPU 분할
    └── timeslicing/         # GPU 타임슬라이싱
- install.sh: ../base/terraform 내용을 terraform/_LOCAL로 복사한 뒤 그 안의 install.sh를 실행하는 방식으로, base 블루프린트 구조를 재사용합니다.
- terraform/blueprint.tfvars: 클러스터 이름(jark-stack), 활성화할 애드온들(enable_jupyterhub, enable_kuberay_operator, enable_argo_workflows, enable_argo_events, enable_argocd, enable_ai_ml_observability_stack, enable_aws_efs_csi_driver 등)을 정의. NVIDIA DRA/GPU Operator는 주석 처리되어 기본 비활성 상태.
- src/: Stable Diffusion 이미지 생성 데모("dogbooth")를 Ray Serve로 서빙하고 Streamlit UI로 붙여보는 end-to-end 예제 (service/dogbooth.py가 Ray Serve 배포 정의, app/streamlit.py가 프런트엔드).
- examples/k8s-dra/: GPU를 여러 파드가 공유하는 다양한 방식(MIG, MPS, timeslicing 등)을 보여주는 K8s DRA 파드/클레임 예제 매니페스트
- infra/jark-stack/ 내용
- JARK는 JupyterHub + Argo Workflows + Ray + Kubernetes의 앞글자를 딴 이름으로, Amazon EKS 위에서 생성형 AI/ML 모델의 훈련·파인튜닝·추론을 위한 환경을 한 번에 구축해주는 인프라 블루프린트입니다 (ai-on-eks 리포지토리의 일부)
- 테라폼 구성 확인
infra/base/terraform/karpenter-resources/ ├── karpenter/ # 기본 Karpenter 사용 시 │ ├── default.yaml # 일반 CPU 노드풀 │ ├── gpu.yaml # GPU 노드풀 (g5 등, instance-generation > 4) │ ├── gpu-p.yaml # P시리즈 GPU 노드풀 │ ├── gpu-p-static.yaml # 정적 프로비저닝 P시리즈 │ └── neuron.yaml # AWS Neuron(Inferentia/Trainium) 노드풀 └── auto-mode/ # EKS Auto Mode 사용 시 (default/gpu/neuron.yaml)- gpu.yaml은 karpenter.sh/NodePool + karpenter.k8s.aws/EC2NodeClass로 구성되어 instance-category: g, nvidia.com/gpu taint, spot/on-demand/reserved 등을 정의합니다.
- 테라폼 구성은 infra/base/terraform 에 존재합니다. 위 base 파일을 복사하여 infra/jark-stack/ 에서 지정한 Local의 값으로 수정하여 배포합니다.
필자의 고려사항에 따라 테라폼 코드를 수정하였습니다.
- 배포 리전을 한국 리전, 버전을 1.36으로 설정
- GPU Node Pool 을 Spot 인스턴스로만 구성 (한국 리전 기준. On-demand $3.010 → Spot $0.867)

# infra/jark-stack/terraform/blueprint.tfvars
# 한국 리전 및 버전 변경
name                             = "jark-stack"
enable_aws_efs_csi_driver        = true
enable_jupyterhub                = true
enable_kuberay_operator          = true
enable_argo_workflows            = true
enable_argo_events               = true
enable_argocd                    = true
enable_ai_ml_observability_stack = true
# -------------------------------------------------------------------------------------
# Enable this to NVIDIA K8s DRA Driver with NVIDIA GPU Opeator
#   Check infra/base/terraform/variables.tf for more details
# -------------------------------------------------------------------------------------
# enable_nvidia_dra_driver         = true
# enable_nvidia_gpu_operator       = true
# -------------------------------------------------------------------------------------
# 아래 내용 수정
region                           = "ap-northeast-2"
eks_cluster_version              = "1.36"


# infra/base/terraform/karpenter-resources/karpenter/gpu.yaml
apiVersion: karpenter.sh/v1
kind: NodePool
metadata:
  name: gpu
spec:
  weight: 10
  disruption:
    budgets:
      - nodes: 10%
    consolidateAfter: 300s
    consolidationPolicy: WhenEmptyOrUnderutilized
  template:
    metadata:
      labels:
        ai.eks.amazonaws.com/amiFamily: ${ami_family}
        accelerator: nvidia
    spec:
      expireAfter: 720h
      nodeClassRef:
        group: karpenter.k8s.aws
        kind: EC2NodeClass
        name: gpu
      requirements:
        - key: karpenter.k8s.aws/instance-category
          operator: In
          values:
            - g
        - key: karpenter.k8s.aws/instance-generation
          operator: Gt
          values:
            - "4"
        - key: karpenter.sh/capacity-type
          operator: In
          values: # on-demand 제거
            - reserved
            - spot
      taints:
        - effect: NoSchedule
          key: nvidia.com/gpu
      terminationGracePeriod: 24h
테라폼 배포
chmod +x install.sh
./install.sh - 리소스 배포에 약 10분 정도 소요됩니다.
리소스 확인
aws eks --region ap-northeast-2 update-kubeconfig --name jark-stack

# 노드 확인
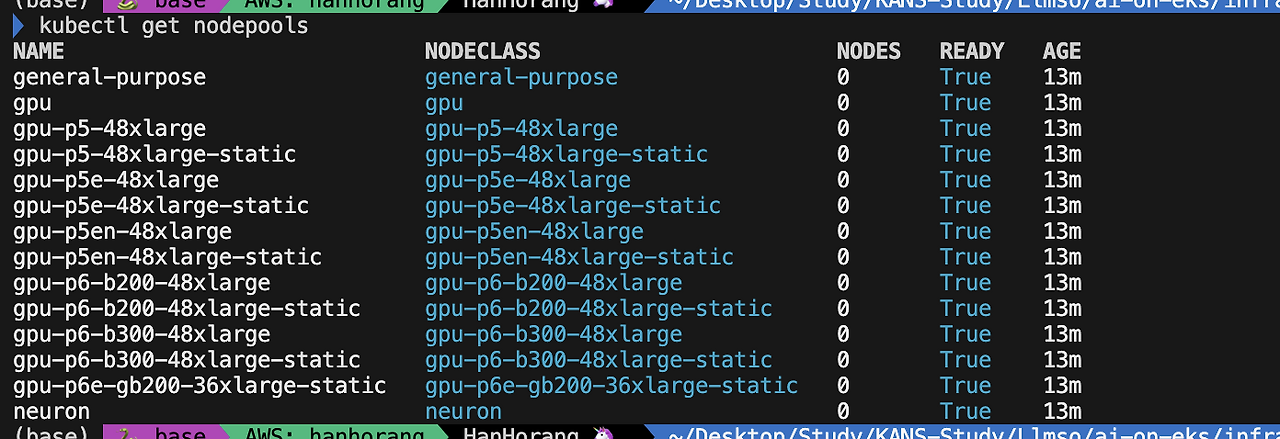
kubectl get nodes -A
kubectl get nodepools

# NVIDIA 디바이스 플러그인
kubectl get pods -n gpu-operator

# Kuberay Operator 확인
kubectl get pods -n kuberay-operator

RayServe와 vLLM을 사용한 Mistral-7B-Instruct-v0.2 배포
필요한 모든 구성 요소와 함께 EKS 클러스터를 배포한 후, RayServe와 vLLM을 사용하여 Mistral-7B-Instruct-v0.2를 배포하는 단계를 진행할 수 있습니다.
Hugginface Hub 토큰 설정
export HUGGING_FACE_HUB_TOKEN=$(echo -n "Your-Hugging-Face-Hub-Token-Value" | base64) 액세스 토큰 발급 방법 : https://huggingface.co/docs/hub/security-tokens
cd ai-on-eks/blueprints/inference/vllm-rayserve-gpu
envsubst < ray-service-vllm.yaml| kubectl apply -f -
ray-service-vllm 구성 확인
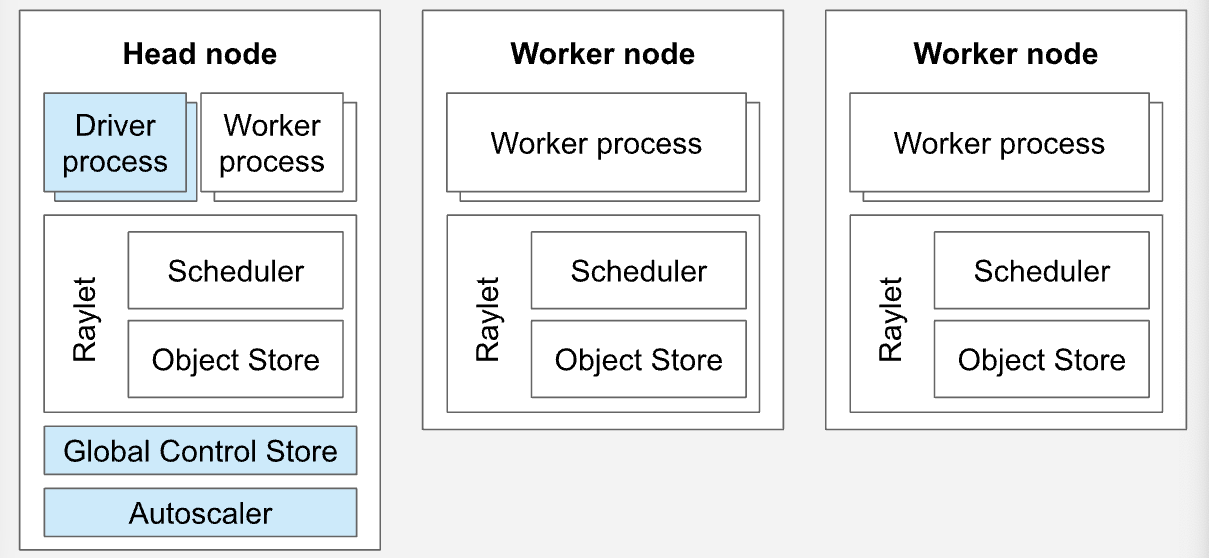
"Ray"라는 분산 처리 프레임워크 위에, "Ray Serve"로 vLLM 모델 서빙을 얹고, 그걸 Kubernetes의 Karpenter가 필요할 때 CPU/GPU 노드를 만들어주는 구조
- Secret — HuggingFace에서 모델(Mistral-7B)을 다운로드할 때 필요한 인증 토큰을 저장합니다.
- RayService (serveConfigV2 부분) — "무엇을, 어떻게 서빙할지"에 대한 설정입니다. vLLM으로 Mistral 모델을 띄우고, 요청량에 따라 몇 개까지 자동으로 늘릴지(오토스케일링)를 정의합니다.
- RayService (rayClusterConfig 부분) — "그 서빙을 실제로 어떤 Pod들 위에서 돌릴지"에 대한 설정입니다. 두 그룹으로 나뉩니다.
- headGroupSpec : Ray 클러스터의 두뇌 역할(스케줄링, 대시보드). CPU 노드에서 돌고, GPU는 안 씁니다.
- workerGroupSpecs : 실제로 GPU를 잡고 vLLM 추론을 수행하는 워커. 여기가 진짜 일꾼입니다.
# 1. rayserve-vllm 이라는 이름의 네임스페이스 생성
#    이 안에 아래의 모든 리소스(Secret, RayService, Pod들)가 격리되어 배포됨
apiVersion: v1
kind: Namespace
metadata:
  name: rayserve-vllm
---
# 2. HuggingFace 인증 토큰을 담는 Secret
#    Mistral-7B 같은 gated 모델을 HuggingFace에서 내려받으려면 토큰이 필요한데,
#    이 값을 컨테이너 환경변수로 안전하게 주입하기 위해 Secret으로 관리
apiVersion: v1
kind: Secret
metadata:
  name: hf-token
  namespace: rayserve-vllm
data:
  hf-token: $HUGGING_FACE_HUB_TOKEN  # 실제 배포 시 base64 인코딩된 토큰 값으로 치환되어야 함
---
# 3. KubeRay Operator가 관리하는 RayService 리소스
#    "Ray 클러스터 생성 + 그 위에 Ray Serve 애플리케이션 배포"를 한 번에 선언하는 커스텀 리소스
apiVersion: ray.io/v1
kind: RayService
metadata:
  name: vllm
  namespace: rayserve-vllm
spec:
  # 서비스 자체가 "비정상"으로 판정되기까지 걸리는 시간(초). 기본 60초는 너무 짧아서
  # 모델 로딩이 오래 걸리는 LLM 서빙에서는 조기에 재시작되는 걸 막기 위해 크게 늘림
  serviceUnhealthySecondThreshold: 1800
  # 개별 배포(deployment) 단위의 헬스체크 임계값도 동일한 이유로 늘림
  deploymentUnhealthySecondThreshold: 1800

  # ---- (A) 무엇을 서빙할지: Ray Serve 애플리케이션 설정 ----
  serveConfigV2: |
    applications:
      - name: mistral
        import_path: "vllm_serve:deployment"   # vllm_serve.py 안의 deployment 객체를 진입점으로 사용
        runtime_env:
          env_vars:
            LD_LIBRARY_PATH: "/home/ray/anaconda3/lib:$LD_LIBRARY_PATH"
            MODEL_ID: "mistralai/Mistral-7B-Instruct-v0.2"  # 서빙할 모델
            GPU_MEMORY_UTILIZATION: "0.9"    # vLLM이 GPU 메모리의 90%까지 점유하도록 허용
            MAX_MODEL_LEN: "8192"            # 최대 컨텍스트 길이(토큰)
            MAX_NUM_SEQ: "4"                 # 동시에 처리할 최대 시퀀스(요청) 수
            MAX_NUM_BATCHED_TOKENS: "32768"  # 한 배치에서 처리할 최대 토큰 수
        deployments:
          - name: mistral-deployment
            # Ray Serve 자체의 오토스케일링 정책 (레플리카 수를 몇 개로 늘리고 줄일지)
            autoscaling_config:
              metrics_interval_s: 0.2          # 부하 지표를 얼마나 자주 확인할지
              min_replicas: 1                  # 최소 레플리카(=최소 GPU 워커) 수
              max_replicas: 4                  # 최대 레플리카 수
              look_back_period_s: 2            # 스케일링 판단 시 참고할 과거 구간
              downscale_delay_s: 600           # 스케일 다운은 10분 대기 후 (너무 자주 줄었다 늘었다 방지)
              upscale_delay_s: 30              # 스케일 업은 30초 대기 후 (빠르게 반응)
              target_num_ongoing_requests_per_replica: 20  # 레플리카 하나당 목표 동시 요청 수, 초과하면 증설
            graceful_shutdown_timeout_s: 5      # 종료 시 처리 중인 요청을 마무리할 유예 시간
            max_concurrent_queries: 100         # 레플리카 하나가 동시에 받을 수 있는 최대 요청 수
            ray_actor_options:
              num_cpus: 1
              num_gpus: 1                       # 레플리카 하나당 GPU 1장 필요 → 즉 워커 Pod 1개 = 요청 처리 단위 1개

  # ---- (B) 어디서 돌릴지: 실제 Ray 클러스터(Pod들) 구성 ----
  rayClusterConfig:
    rayVersion: '2.24.0'          # 컨테이너 이미지에 들어있는 Ray 버전과 일치해야 함
    enableInTreeAutoscaling: true # Ray 자체 오토스케일러를 켜서 workerGroupSpecs의 replicas를 자동 조절

    ######################headGroupSpecs#################################
    # Ray 헤드: 클러스터의 두뇌 역할. 스케줄링, 대시보드, 요청 라우팅을 담당하고
    # 실제 모델 추론(GPU 연산)은 하지 않음 → 그래서 GPU 리소스가 없고 CPU 노드에 배치됨
    headGroupSpec:
      headService:
        metadata:
          name: vllm
          namespace: rayserve-vllm
      rayStartParams:
        dashboard-host: '0.0.0.0'  # Ray 대시보드를 외부에서 접근 가능하게 바인딩
        num-cpus: "0"              # 헤드 노드는 실제 작업(task)을 스케줄링받지 않도록 CPU 슬롯을 0으로 선언
      # Pod template: 헤드가 뜨는 실제 Pod 스펙
      template:
        spec:
          containers:
          - name: ray-head
            image: public.ecr.aws/data-on-eks/ray2.24.0-py310-vllm-gpu:v1
            imagePullPolicy: IfNotPresent
            lifecycle:
              preStop:
                exec:
                  # Pod 종료 신호를 받으면 먼저 ray stop으로 클러스터에서 안전하게 빠져나감
                  command: ["/bin/sh", "-c", "ray stop"]
            ports:
            - containerPort: 6379
              name: gcs          # Ray의 글로벌 컨트롤 스토어(클러스터 메타데이터) 포트
            - containerPort: 8265
              name: dashboard    # Ray 대시보드 UI 포트
            - containerPort: 10001
              name: client       # Ray 클라이언트 연결 포트
            - containerPort: 8000
              name: serve        # Ray Serve가 HTTP 요청을 받는 포트
            volumeMounts:
            - mountPath: /tmp/ray
              name: ray-logs     # Ray 로그를 담을 임시 볼륨 마운트
            # 헤드 자체는 추론을 안 하지만, 대형 이미지를 pull하고 대시보드/스케줄링을 돌리기 위한 최소 리소스
            resources:
              limits:
                cpu: 2
                memory: "12G"
              requests:
                cpu: 2
                memory: "12G"
            env:
            # vLLM 기본 포트(8000)가 Ray Serve 포트(8000)와 겹치므로 충돌 방지용으로 재지정
            # (참고: g5 인스턴스 하나에 레플리카를 여러 개 띄우면 포트 충돌로 아래와 같은 에러가 날 수 있음
            #  "torch.distributed.DistNetworkError: ... Address already in use")
            - name: VLLM_PORT
              value: "8004"
            - name: LD_LIBRARY_PATH
              value: "/home/ray/anaconda3/lib:$LD_LIBRARY_PATH"
            - name: HUGGING_FACE_HUB_TOKEN
              valueFrom:
                secretKeyRef:
                  name: hf-token   # 위에서 만든 Secret에서 토큰 값을 읽어와 환경변수로 주입
                  key: hf-token
            # Ray 클러스터 메트릭을 기존에 떠 있는 kube-prometheus-stack(Grafana/Prometheus)에 연결
            - name: RAY_GRAFANA_HOST
              value: http://kube-prometheus-stack-grafana.kube-prometheus-stack.svc:80
            - name: RAY_PROMETHEUS_HOST
              value: http://kube-prometheus-stack-prometheus.kube-prometheus-stack.svc:9090
          # 헤드 Pod은 GPU가 필요 없으므로, Karpenter가 관리하는 x86 CPU 노드 그룹에 배치
          nodeSelector:
            NodeGroupType: x86-cpu-karpenter
            type: karpenter
          volumes:
          - name: ray-logs
            emptyDir: {}   # Pod 생명주기 동안만 유지되는 임시 로그 저장소

    workerGroupSpecs:
    # 실제 vLLM 추론이 일어나는 GPU 워커 그룹
    - replicas: 1          # 시작 시 워커 Pod 1개
      minReplicas: 1       # 최소 1개는 항상 유지
      maxReplicas: 4       # 위 autoscaling_config의 max_replicas(4)와 맞춰 최대 4개까지 확장
      groupName: gpu-group
      rayStartParams: {}
      # Pod template: 워커가 뜨는 실제 Pod 스펙
      template:
        spec:
          containers:
          - name: ray-worker
            image: public.ecr.aws/data-on-eks/ray2.24.0-py310-vllm-gpu:v1
            imagePullPolicy: IfNotPresent
            lifecycle:
              preStop:
                exec:
                  command: ["/bin/sh", "-c", "ray stop"]   # 종료 시 클러스터에서 안전하게 탈퇴
            # 워커 Pod 하나당 GPU 1장을 통째로 요청 (앞서 이야기한 DRA 없이 쓰는 "기존 방식"의 예시)
            # → 즉 이 매니페스트는 Basic(배타적) 방식으로 GPU를 할당받음
            resources:
              limits:
                cpu: 10
                memory: "60G"
                nvidia.com/gpu: 1
              requests:
                cpu: 10
                memory: "60G"
                nvidia.com/gpu: 1
            env:
            - name: VLLM_PORT
              value: "8004"   # 헤드와 동일하게 포트 충돌 방지
            - name: LD_LIBRARY_PATH
              value: "/home/ray/anaconda3/lib:$LD_LIBRARY_PATH"
            - name: HUGGING_FACE_HUB_TOKEN
              valueFrom:
                secretKeyRef:
                  name: hf-token
                  key: hf-token
          # GPU가 필요하므로 Karpenter가 관리하는 g5 GPU 노드 그룹에 배치
          nodeSelector:
            NodeGroupType: g5-gpu-karpenter
            type: karpenter
          # GPU 노드에는 보통 taint(nvidia.com/gpu=NoSchedule)가 걸려있어서,
          # 이를 감내(toleration)하겠다고 명시해야 워커 Pod이 그 노드에 스케줄링될 수 있음
          tolerations:
          - key: "nvidia.com/gpu"
            operator: "Exists"
            effect: "NoSchedule"
배포 자원은 두개로 분류됩니다.
- RayService(vllm) — 사용자가 직접 배포한 리소스. serveConfigV2(어떤 모델을 어떻게 서빙할지)와 rayClusterConfig(어떤 스펙의 클러스터를 만들지)를 함께 갖고 있는 상위 관리자 역할.
- RayCluster(vllm-xxxx) — RayService가 rayClusterConfig를 보고 자동 생성한 실제 실행 단위. Head 파드 + Worker 파드(GPU 노드에서 뜬 그 파드)가 여기 속해있음. 이름 뒤에 붙은 8gkpl은 RayService가 자동 생성할 때 붙이는 랜덤 접미사입니다.
즉 RayCluster는 "Ray 컴퓨팅 클러스터 자체"만 담당하고(파드/노드 오케스트레이션), RayService는 거기에 모델 서빙 앱까지 얹어서 관리 + 무중단 롤링 업데이트까지 해주는 상위 개념입니다.
- RayCluster 버전 버그 이슈
KubeRay operator 버전이 이 필드를 명시적으로 지정하는 걸 금지하고 있습니다 (최신 KubeRay는 headService 이름을 자동 생성하도록 강제합니다.Warning InvalidRayServiceSpec ... rayservice-controller The RayService spec is invalid rayserve-vllm/vllm: spec.rayClusterConfig.headGroupSpec.headService.metadata.name should not be set######################headGroupSpecs################################# # Ray head pod template. headGroupSpec: # headService: # metadata: # name: vllm # namespace: rayserve-vllm rayStartParams: dashboard-host: '0.0.0.0' num-cpus: "0" # Pod template template:- headService ?왜 이게 막혀있고, 삭제하면 되는 이유(참고: 이 검증은 CRD 스키마 레벨이 아니라 rayservice-controller의 reconcile 로직 안에 있어서 kubectl explain으로는 안 보이고, kubectl apply는 성공하지만 이후 컨트롤러가 리소스를 거부하는 방식으로 나타납니다 — 그래서 Namespace/Secret/RayService 오브젝트는 생성됐는데 RayCluster는 안 만들어진 거예요.)
- 이 필드는 없어도 기능상 손해가 없습니다 — 어차피 KubeRay가 자동으로 안정적인 이름의 Service를 만들어서 관리해주기 때문에, 굳이 사용자가 지정할 이유가 없는 필드입니다.
- RayService(단순 RayCluster가 아니라)는 무중단 배포(zero-downtime upgrade) 기능이 있습니다. 설정을 바꿔서 재배포할 때, 기존 RayCluster를 바로 지우지 않고 새 RayCluster를 하나 더 띄운 뒤 트래픽을 전환(blue/green) 하는 방식으로 동작해요. 이 전환을 하려면 Head Service 이름을 컨트롤러가 직접 관리해야 하는데, 사용자가 이름을 고정해버리면 이 내부 전환 로직과 충돌합니다. 그래서 최근 KubeRay 버전(지금 클러스터엔 v1.5.1)부터는 RayService에서 headService.metadata를 사용자가 지정하는 걸 아예 금지하도록 컨트롤러 로직에 검증이 추가됐습니다.
- 원래 KubeRay는 이 Service 이름을 <클러스터이름>-head-svc 형태로 자동 생성합니다. 위 블록은 그걸 vllm이라는 이름으로 강제 고정하려는 시도였던 거예요.
- 아래와 같이 headService를 제외합니다.
- KubeRay operator가 v1.5.1인데, 해당 버전에서 headService.metadata.name 수동 지정이 금지되어 rayCluster 자체가 배포되지 않습니다.
- Ray Pod 스케쥴링 이슈각 파드에 대해 라벨을 다시 설정합니다.
⏺ Update(blueprints/inference/vllm-rayserve-gpu/ray-service-vllm.yaml) Removed 3 lines value: <http://kube-prometheus-stack-grafana.kube-prometheus-stack.svc:80> - name: RAY_PROMETHEUS_HOST value: <http://kube-prometheus-stack-prometheus.kube-prometheus-stack.svc:9090> nodeSelector: NodeGroupType: x86-cpu-karpenter type: karpenter volumes: - name: ray-logs emptyDir: {} ⏺ Update(blueprints/inference/vllm-rayserve-gpu/ray-service-vllm.yaml) Added 1 line, removed 1 line name: hf-token key: hf-token nodeSelector: accelerator: nvidia karpenter.sh/nodepool: gpu # Please add the following taints to the GPU node. tolerations: - key: "nvidia.com/gpu" - Events: Type Reason Age From Message ---- ------ ---- ---- ------- Warning FailedScheduling 7m49s karpenter Failed to schedule pod, did not tolerate taint (taint=aws.amazon.com/neuron:NoSchedule); did not tolerate taint (taint=nvidia.com/gpu:NoSchedule); did not tolerate taint (taint=nvidia.com/gpu:NoSchedule); did not tolerate taint (taint=nvidia.com/gpu:NoSchedule); did not tolerate taint (taint=nvidia.com/gpu:NoSchedule); incompatible requirements, label "type" does not have known values (typo of "karpenter.sh/capacity-type"?) Warning FailedScheduling 2m39s (x2 over 12m) karpenter Failed to schedule pod, did not tolerate taint (taint=aws.amazon.com/neuron:NoSchedule); did not tolerate taint (taint=nvidia.com/gpu:NoSchedule); did not tolerate taint (taint=nvidia.com/gpu:NoSchedule); did not tolerate taint (taint=nvidia.com/gpu:NoSchedule); did not tolerate taint (taint=nvidia.com/gpu:NoSchedule); incompatible requirements, label "NodeGroupType" does not have known values Warning FailedScheduling 2m30s (x3 over 12m) default-scheduler 0/2 nodes are available: 2 node(s) didn't match Pod's node affinity/selector. no new claims to deallocate, preemption: 0/2 nodes are available: 2 Preemption is not helpful for scheduling 이거 맞는거 아니여?? 라벨 문제 맞아?
- 카펜터 라벨 중 x86 인스턴스, g5 GPU 인스턴스가 맞지 않아 파드가 배치되지 않은 이슈입니다.
- SPOT 인스턴스 프로비저닝 이슈스팟 인스턴스를 처음 사용하면 AWSServiceRoleForEC2Spot 서비스 역할을 계정에 추가로 할당해야 합니다. AWS 계정 중 하나에 위 역할을 할당하면 해결됩니다.
- aws iam create-service-linked-role --aws-service-name spot.amazonaws.com --profile hsh
- AuthFailure.ServiceLinkedRoleCreationNotPermitted: The provided credentials do not have permission to create the service-linked role for EC2 Spot Instances.
구성 확인
# 서비스 확인
kubectl get pod -n rayserve-vllm
kubectl get svc -n rayserve-vllm


# 포트포워딩
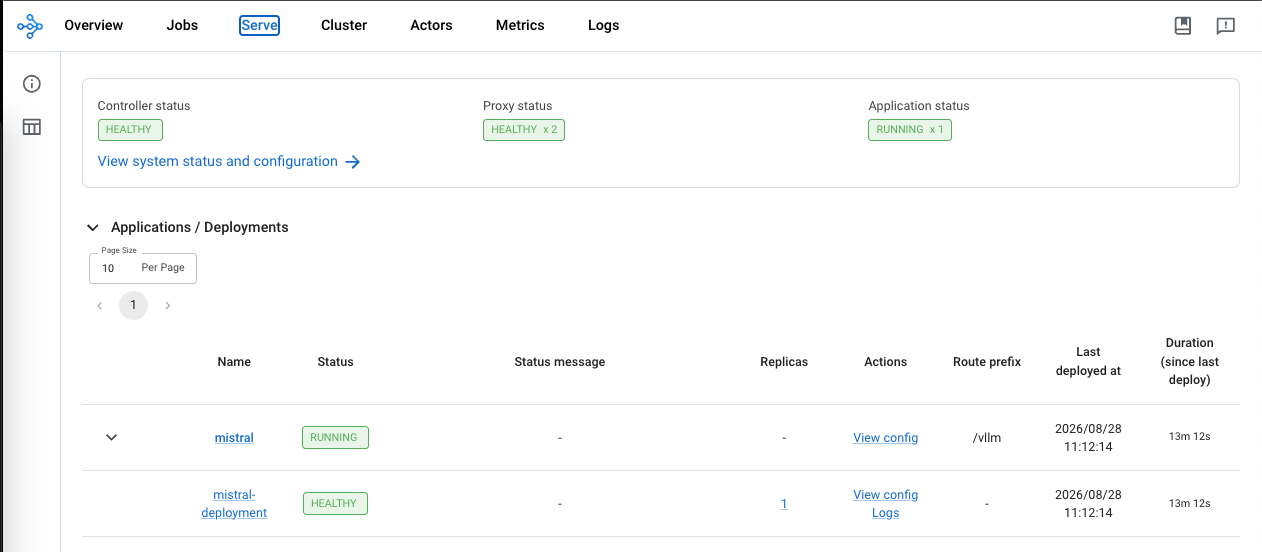
kubectl port-forward svc/vllm-head-svc -n rayserve-vllm 8265:826565 

채팅 모델 테스트
Python 클라이언트 스크립트를 사용하여 RayServe 추론 엔드포인트에 프롬프트를 보내고 모델이 생성한 출력을 확인하겠습니다.
크립트는 prompts.txt 파일에서 프롬프트를 읽고 응답을 같은 위치의 results.txt 파일로 결과를 반환합니다.
서빙 서비스 포트포워딩
kubectl -n rayserve-vllm port-forward svc/vllm-serve-svc 8000:8000
클라이언트 호출
cd ai-on-eks/blueprints/inference/vllm-rayserve-gpu
python3 -m venv .venv
source .venv/bin/activate
pip install requests aiohttp
python3 client.py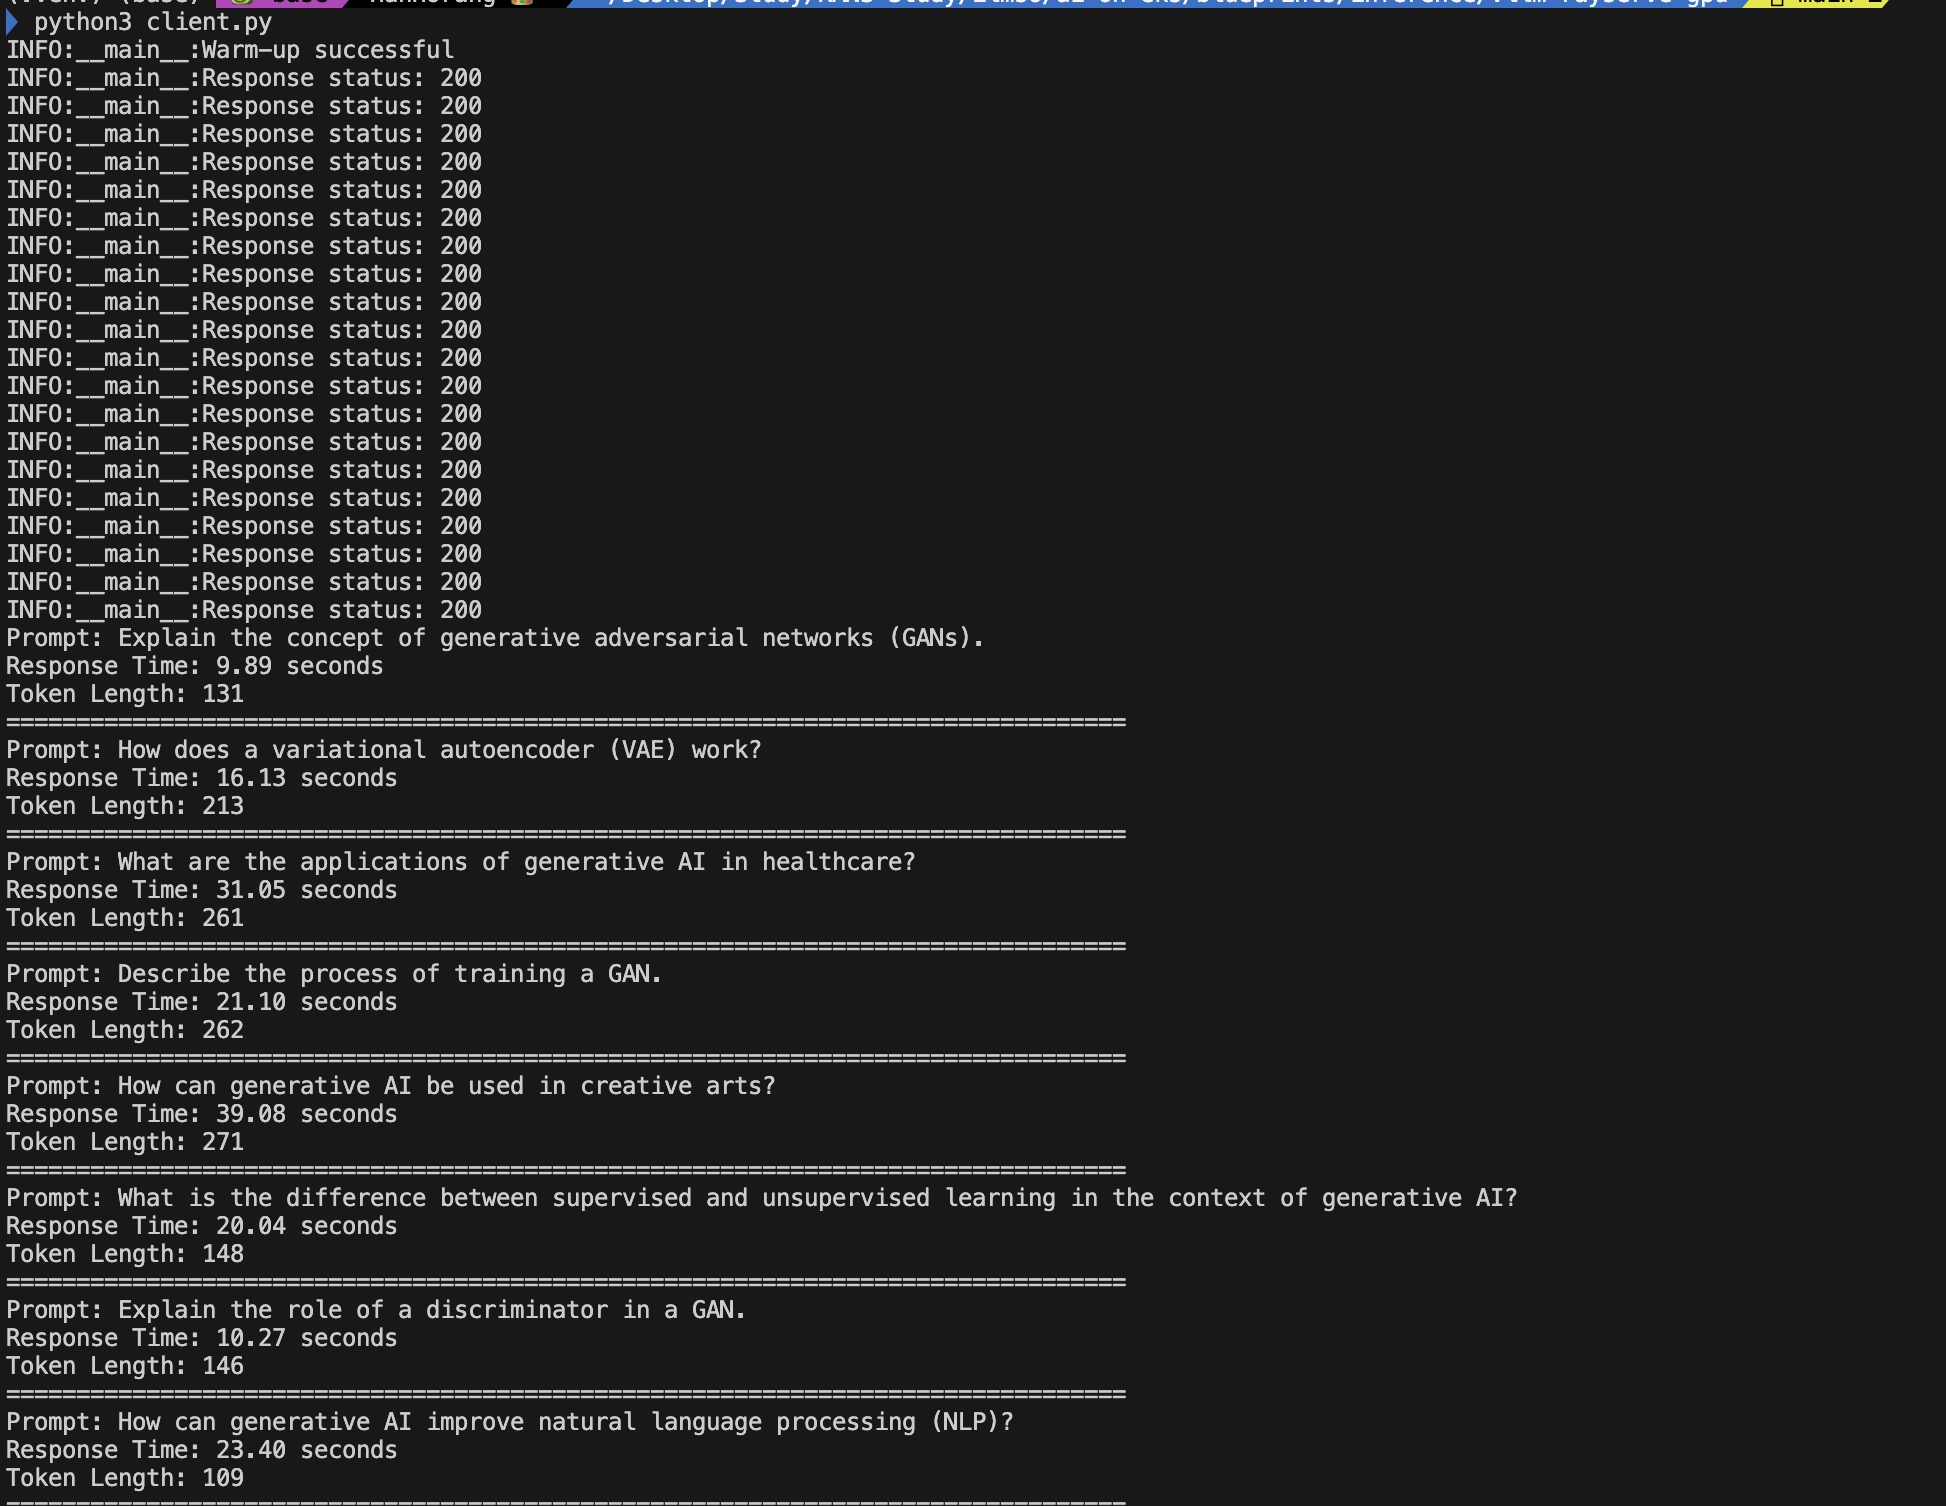
관측성 확인
Promehtues 서버와 Grafana 를 통해 모니터링 지표를 확인하겠습니다.
[Ray Head 파드] ──(메트릭 노출: :8080)──┐
[Ray Worker 파드] ─(메트릭 노출: :8080)─┤
                                    │  Prometheus가 "당겨가는(pull/scrape)" 방식
                                    ▼
                              [Prometheus]  ← 시계열 메트릭 DB
                                    │
                                    ▼
                              [Grafana]  ← Prometheus를 데이터소스로 조회해서 그래프 그림
프로메테우스 구성 확인
ArogCD를 통해 배포되어 있습니다 이해를 위해 구성부를 확인합니다.
Kube Prometheus 스택 서비스를 확인한 후 Ray 클러스터를 종합적으로 모니터링하도록 Prometheus를 구성해야 합니다. 이를 위해 ServiceMonitor와 PodMonitor 리소스를 모두 배포해야 합니다
ai-ml-observability-reference-architecture/chart/templates/endpoints at main · awslabs/ai-ml-observability-reference-architectu
Contribute to awslabs/ai-ml-observability-reference-architecture development by creating an account on GitHub.
github.com
ServiceMonitor : 이 라벨을 가진 Service를 찾아라, 그리고 그 Service가 가리키는 Pod들의 이 포트/경로를 스크랩하는 설정입니다. 메트릭 엔드포인트를 노출하는 Kubernetes 서비스가 있는 Ray head 노드에서 메트릭을 수집하는 데 사용됩니다.
ServiceMonitor (label selector로 특정 Service를 지목)
   ↓
Service (label selector로 특정 Pod들을 지목, Endpoints에 Pod IP 목록 보유)
   ↓
실제 Pod들 (거기서 /metrics 열려있음)
{{- if .Values.endpoints.enabled }} # ① Helm 조건문 — values.yaml 설정에 따라 이 리소스 자체를 켜고 끔
...
metadata:
labels:
release: kube-prometheus-stack # ② ★핵심★ — 이 라벨이 없으면 Prometheus가 이 ServiceMonitor를 아예 무시함
spec:
jobLabel: ray-head # ③ 수집된 메트릭에 붙는 job="ray-head" 라벨 이름 지정
namespaceSelector:
any: true # ④ "내 네임스페이스(monitoring)만 보지 말고 전체 네임스페이스에서 찾아라"
selector:
matchLabels:
ray.io/node-type: head # ⑤ ★타겟 찾기★ — 이 라벨 붙은 "Service"를 자동으로 찾아냄
endpoints:
- port: metrics # ⑥ 그 Service가 노출한 named port 중 어떤 포트를 긁을지
- port: as-metrics
- port: dash-metrics
- port: serve
targetLabels:
- ray.io/cluster # ⑦ Service의 k8s 라벨을 메트릭에 그대로 복사해서 붙임
{{- end }}- ② 라벨 검사: Prometheus Operator가 관리하는 Prometheus CR(kube-prometheus-stack-prometheus)에는 serviceMonitorSelector: {matchLabels: {release: kube-prometheus-stack}} 조건이 걸려있습니다. 이 라벨이 없으면 ServiceMonitor를 만들어도 Prometheus가 존재 자체를 모릅니다(opt-in 방식).
- ④+⑤ 타겟 탐색: namespaceSelector: any: true + selector: ray.io/node-type: head 조합으로 "모든 네임스페이스를 뒤져서 ray.io/node-type: head 라벨 붙은 Kubernetes Service를 찾아라"고 지시. 실제로 KubeRay가 Head Service(vllm-head-svc)를 만들 때 이 라벨을 자동으로 붙여줍니다. 그래서 이름이 매번 바뀌어도(vllm-8gkpl-head-svc → vllm-97kqb-head-svc) 라벨로 찾으니까 계속 추적 가능한 겁니다.
- ⑥ 포트 선택: 찾아낸 Service가 노출한 여러 named port(metrics, as-metrics, dash-metrics, serve) 각각에 대해 http://<service>:<포트>/metrics로 주기적 HTTP GET을 날려서 텍스트 형식 메트릭을 수집. 4개 엔드포인트 각각이 별도의 "job"이 됨:
- ⑦ 라벨 부착: Service의 k8s 라벨 ray.io/cluster(값 = RayCluster 이름, 예: vllm-8gkpl) 값을 복사해서 수집된 모든 메트릭에 ray_io_cluster="vllm-8gkpl" 형태로 붙여줌 → 나중에 Grafana에서 "어느 RayCluster 인스턴스의 메트릭인지" 필터링 가능
PodMonitor는 KubeRay 오퍼레이터가 Ray 워커 파드에 대한 Kubernetes 서비스를 생성하지 않기 때문에 필요합니다. 따라서 ServiceMonitor를 사용하여 워커 파드에서 메트릭을 스크랩할 수 없으므로 대신 PodMonitors CRD를 사용해야 합니다.
PodMonitor (label selector로 Pod을 직접 지목)
   ↓
실제 Pod들 (거기서 /metrics 열려있음)
apiVersion: monitoring.coreos.com/v1
kind: PodMonitor
metadata:
name: ray-workers-monitor
namespace: {{ .Release.Namespace }}
labels:
release: kube-prometheus-stack
spec:
selector:
matchLabels:
ray.io/node-type: worker # Service가 아니라 "Pod"을 직접 라벨로 찾음
podMetricsEndpoints:
- port: metrics
relabelings: # Prometheus의 relabel_config — 저수준 라벨 재작성 규칙
- sourceLabels: [__meta_kubernetes_pod_label_ray_io_cluster]
targetLabel: ray_io_cluster
- sourceLabels: [__meta_kubernetes_pod_host_ip]
targetLabel: node_instance
- KubeRay는 Worker용 Service를 안 만듭니다 (Head만 Service 있음). 그래서 ServiceMonitor로는 아예 접근 불가 → selector가 Service가 아니라 Pod을 직접 찾도록 되어있는 PodMonitor를 씁니다.
- relabelings는 ServiceMonitor의 targetLabels와 목적은 같은데(라벨 붙이기), Pod 단위라 문법이 더 저수준입니다
ray-prometheusrule에는 커스텀 메트릭 및 알람 설정이 구성됩니다.
# monitoring.coreos.com/v1 PrometheusRule = Prometheus Operator의 CRD.
# ServiceMonitor/PodMonitor와 달리 "타겟 탐색"이 아니라 "PromQL 계산 규칙"을 담는 리소스.
apiVersion: monitoring.coreos.com/v1
kind: PrometheusRule
metadata:
  name: ray-cluster-gcs-rules
  namespace: {{ .Release.Namespace }}
  labels:
    # ★핵심★ 이 라벨이 없으면 Prometheus가 이 룰을 아예 무시함.
    # Prometheus CR의 ruleSelector가 이 라벨을 가진 PrometheusRule만 골라서 로드하는 opt-in 방식.
    release: kube-prometheus-stack
spec:
  groups:
    # "규칙 그룹" — 여기 묶인 rule들은 같은 주기로 한꺼번에 재평가됨.
    - interval: 30s              # 이 그룹의 모든 rule을 30초마다 재계산 (스크랩 주기와는 별개)
      name: ray-cluster-main-staging-gcs.rules   # Prometheus UI의 Rules 페이지에 표시되는 그룹 이름
      rules:

        # -------------------------------------------------------------
        # Recording Rule
        # 목적: 무거운 쿼리를 매번 다시 계산하지 않고, 미리 계산해서
        #       새로운 시계열(메트릭)로 저장해두는 "캐싱" 메커니즘.
        # -------------------------------------------------------------
        - expr: |2
                          (
                            100 * (
                                    sum(
                                         # ray_gcs_update_resource_usage_time_bucket:
                                         #   Ray GCS(클러스터 컨트롤 플레인)의 요청 처리 시간을 담은 히스토그램.
                                         # le="20.0":
                                         #   그 히스토그램에서 "20초 이내에 처리된" 버킷만 선택.
                                         rate(
                                               ray_gcs_update_resource_usage_time_bucket{container="ray-head", le="20.0"}[30d]
                                         )
                                         # rate(...[30d]) = 최근 30일 구간의 초당 증가율(=처리 속도)
                                    )
                                    /
                                    sum(
                                         # 분모: 처리 속도(빠르든 느리든) 전체 요청의 초당 증가율
                                         rate(
                                               ray_gcs_update_resource_usage_time_count{container="ray-head"}[30d]
                                         )
                                    )
                            )
                            # (20초 이내 처리량) / (전체 처리량) × 100
                            # = "최근 30일간 GCS가 SLA(20초) 안에 응답한 비율(%)"
                          )
          # record: 계산 결과를 이 이름의 새 메트릭으로 저장.
          # Grafana는 무거운 원본 쿼리 대신 이 완성된 값만 가져다 그리면 됨.
          record: ray_gcs_availability_30d

        # -------------------------------------------------------------
        # Alerting Rule
        # 목적: 특정 조건이 만족되면 Alertmanager로 알림을 발생시킴.
        # -------------------------------------------------------------
        - alert: MissingMetricRayGlobalControlStore
          annotations:
            # 사람이 읽는 설명 텍스트 — 알림 로직에는 영향 없음, 화면 표시용.
            description: Ray GCS is not emitting any metrics for Resource Update requests
            summary: Ray GCS is not emitting metrics anymore
          expr: |2
                          (
                           # absent(metric) == 1
                           #   → 이 메트릭 시계열이 Prometheus에 "아예 존재하지 않으면" 1을 반환.
                           #   → Head 파드가 죽었거나, 스크랩이 끊겼거나, 포트가 안 열려있을 때 감지됨.
                           absent(ray_gcs_update_resource_usage_time_bucket) == 1
                          )
          # for: 5m
          #   → 위 조건이 "5분 연속" 참이어야 실제로 알림 발동.
          #   → 파드 재시작 같은 순간적 blip으로 오탐 안 나게 막는 디바운스 장치.
          for: 5m
          labels:
            # Alertmanager가 이 라벨 보고 라우팅 경로(Slack/이메일 등) 결정.
            severity: critical
{{- end }}
그라파나 통합
Ray 대시보드 통합하기 위해 Ray 클러스터 구성에서 특정 환경 변수를 추가합니다.
env:
  - name: RAY_GRAFANA_HOST
    value: http://kube-prometheus-stack-grafana.kube-prometheus-stack.svc:80
  - name: RAY_PROMETHEUS_HOST
value: http://kube-prometheus-stack-prometheus.kube-prometheus-stack.svc:9090- RAY_GRAFANA_HOST는 Grafana에 대한 내부 Kubernetes 서비스 URL을 정의합니다. Ray head 파드는 클러스터 내에서 백엔드 헬스 체크 및 통신에 이를 사용합니다.
- RAY_PROMETHEUS_HOST는 Prometheus에 대한 내부 Kubernetes 서비스 URL을 지정하여 Ray가 필요할 때 메트릭을 쿼리할 수 있도록 합니다.
대시보드 접근 후 RayCluster 커스텀 대시보드를 구성합니다.
infra/base/terraform/monitoring/ray-dashboards/
├── default_grafana_dashboard.json           # Ray 코어 메트릭 (태스크, 액터, 리소스 등)
├── data_grafana_dashboard.json              # Ray Data 관련 메트릭
├── serve_grafana_dashboard.json             # Ray Serve 전체 메트릭
└── serve_deployment_grafana_dashboard.json  # Ray Serve 배포(디플로이먼트)별 상세 메트릭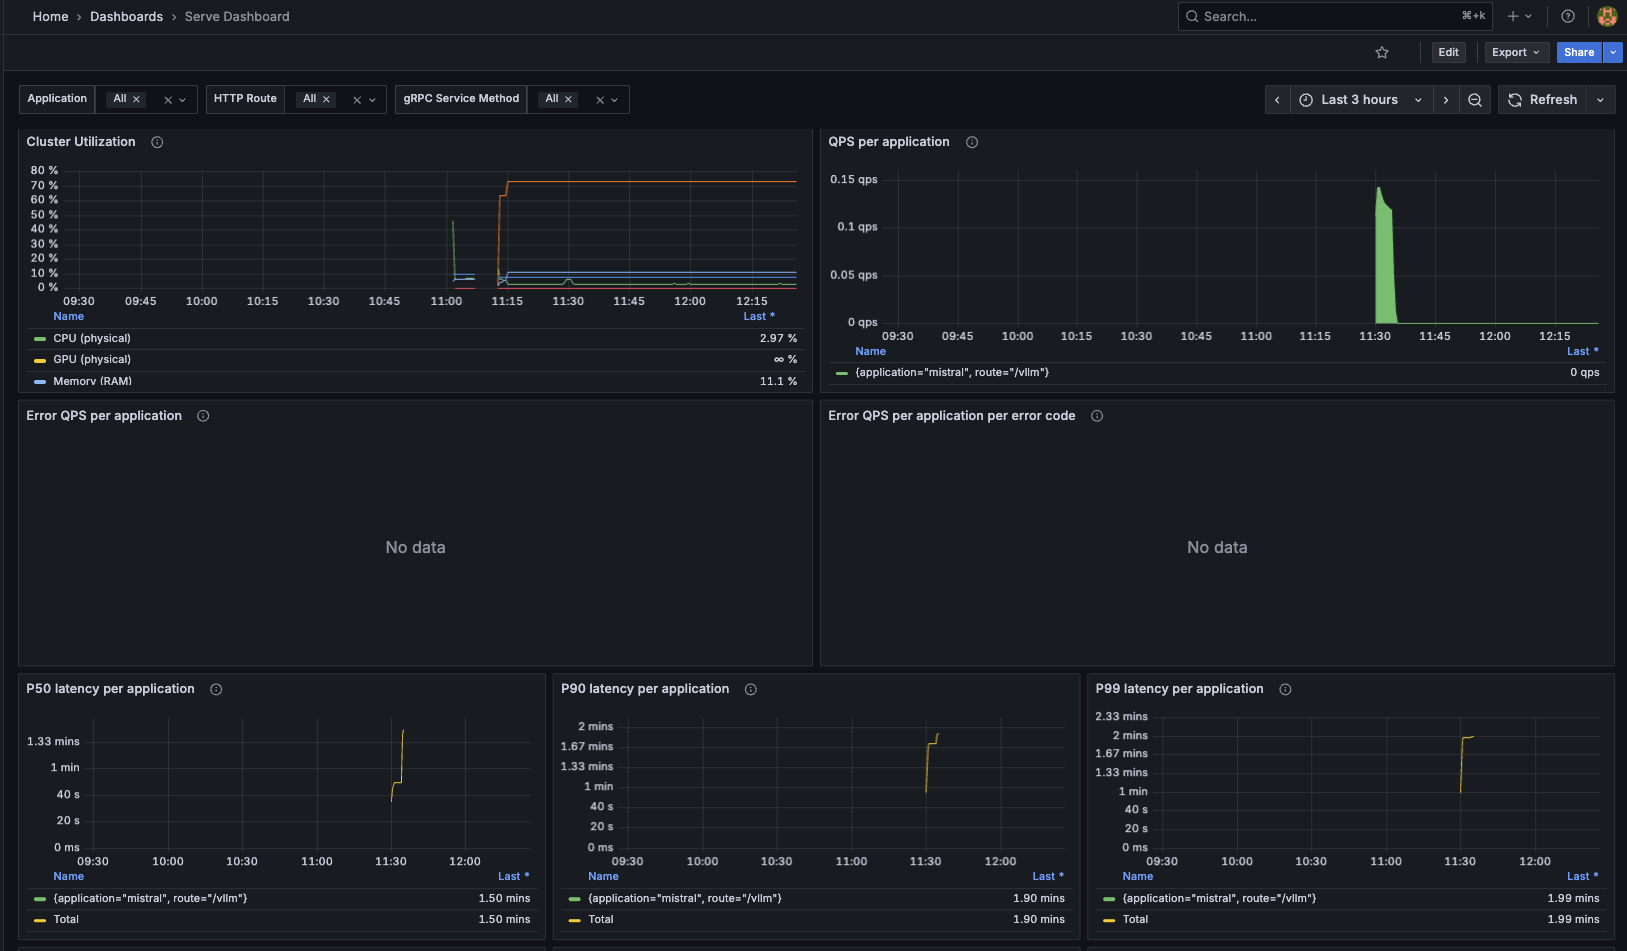
트래픽 / 성능
|
패널
|
설명
|
메트릭
|
|
QPS per application
|
초당 요청 수 (/vllm 엔드포인트 트래픽)
|
rate(ray_serve_num_http_requests_total[5m])
|
|
P50/P90/P99 latency per application
|
응답 지연시간 분포, P99가 느린 요청 꼬리를 나타냄
|
histogram_quantile(0.99, rate(ray_serve_http_request_latency_ms_bucket[5m]))
|
|
Error QPS per application
|
초당 에러(4xx/5xx) 응답 수
|
rate(ray_serve_num_http_error_requests_total[5m])
|
오토스케일링 / 용량 상태
|
패널
|
설명
|
메트릭
|
|
Replicas per deployment
|
mistral-deployment 현재 레플리카 수 (min 1 ~ max 4)
|
ray_serve_deployment_replica_healthy
|
|
Queue size per deployment
|
처리 대기 중인 요청 수, 계속 쌓이면 레플리카 부족 신호
|
ray_serve_deployment_queued_queries
|
|
Ongoing HTTP Requests
|
동시 처리 중인 요청 수 (max_concurrent_queries: 100 대비 확인)
|
-
|
클러스터 레벨
|
패널
|
설명
|
|
Cluster Utilization
|
전체 CPU/GPU/메모리 사용률
|
|
Node count
|
현재 워커 노드 수 (GPU 스케일 아웃 확인)
|
자원 삭제
export AWS_DEAFULT_REGION="ap-northesat-2"

cd ai-on-eks/infra/jark-stack/terraform/_LOCAL
terraform destroy -auto-approve -var-file=../blueprint.tfvars
'AI' 카테고리의 다른 글
| Essential LLM Optimization Techniques (0) | 2026.08.22 |
|---|---|
| Challenges When Serving LLMs (1) | 2026.08.22 |
| Model Serving Best Practices (0) | 2026.08.16 |
| Model Serving System Design: A Deep Dive (0) | 2026.08.16 |
| LLM 모델 서빙 (0) | 2026.08.09 |